![]()
This study is an attempt to move beyond the simple categories of wetting and non-wetting materials, and identify quantifiable metrics that can be useful to the insulation system designer.
Abstract
The designer of industrial equipment and piping has three weapons in the fight against corrosion under insulation (CUI). The first and primary defense against CUI is a high quality, immersion grade coating. The second is a properly designed and installed weather barrier jacketing. The third and, arguably, least understood element is the choice of insulation material. This paper will explore the ways in which insulation materials influence CUI behavior, presenting results from both laboratory- and field-testing on seven industrial insulation materials and one composite system. The materials tested were calcium silicate, expanded perlite, cellular glass, mineral wool (both regular and water-repellent grade), and two types of flexible aerogel blanket material, Pyrogel XT and Cryogel Z.
Introduction
The designer of industrial insulation systems has three main weapons in the fight against corrosion under insulation (CUI). The first and primary defense against CUI is a high quality, immersion-grade coating. The second is a properly designed and installed weather barrier jacketing and, if operating below the atmospheric dew point, vapor barrier. The third and, arguably, least understood element is the choice of insulation material. Historically, hot insulation products have been divided into categories of wetting and non-wetting, or “hydrophobic” materials. The distinction is important because, as pointed out in NACE Standard RP0198-98:
“Because CUI is a product of wet metal exposure duration, the insulation system that holds the least amount of water and dries most quickly should result in the least amount of corrosion damage to equipment.”
A more recent European monograph states flatly:
“Insulation that minimizes water ingress and does not retain water can effectively act as a barrier to CUI.”
Nevertheless, though many engineers do prescribe the use of water-repellent materials on equipment operating in the CUI range (-4 to 175°C, or 25-347°F), the practice is far from universal. Some of the reluctance undoubtedly stems from cost sensitivity, since water-repellent insulation materials are generally more expensive than their water-absorbent cousins. Such sensitivity is often misplaced, as the cost, hazard, and disruption of even one corrosion event can far outweigh any savings – real or perceived – on insulation materials.
Another barrier to the effective use of water-repellent materials is simply the general lack of comparative material data for different insulation products. Although previous authors have addressed the pros and cons of various insulation materials (e.g., Refs. and ), the approach has typically been one of cataloging CUI outcomes within operating facilities. While those insights are invaluable, they don’t allow the isolation of specific variables or mechanisms – of which there are many – because they are basically uncontrolled experiments.
To address this gap in the literature, the authors spent over a year doing laboratory testing on some of the most common hot insulation materials, including:
- Calcium silicate
- Expanded perlite (two different brands)
- Cellular glass
- Mineral wool, including both regular and water-repellent grade (WRG)
- Two types of flexible aerogel blanket material, Pyrogel XT and Cryogel Z.
As described in the sections below, the four sets of laboratory tests focused on: 1) the effectiveness of various corrosion inhibitors, 2) hydrophobe durability, 3) maximum water uptake, and 4) dry-out kinetics. In addition, each of these materials was subjected to 12 weeks of outdoor exposure on a bare-steel test rig to provide a more “real world” perspective. The results have been distilled into a set of rankings, provided in the Conclusions section.
The Role of Insulation in CUI
Insulation materials contribute to CUI in the following three ways:
- Providing an annular space which can collect water and other corrosive media
- Leaching out contaminants that accelerate the corrosion process, and
- Wicking and/or absorbing water and holding it against the substrate. 1
Item 1 is less a question of material composition than of form factor. An annular gap is inherent to pipe cover, as the inside diameter must be oversized to accommodate the worst-case tolerance stack-up of both the pipe and the insulation. Flexible blanket materials, spray-applied products and, to a lesser extent, V-grooved board are more conformal to the substrate and so provide less space for water retention between the insulation and the surface of the piping or equipment. All else being equal, conformal insulation products will be less prone to CUI than pipe cover.
The leaching of contaminants is a material issue, and has received considerable attention. ASTM, for example, has in place a suite of test protocols (C692, C871) and acceptance standards (C795) that describe the requirements around contaminant leaching, particularly as it concerns stress corrosion cracking of austenitic stainless steels. Because several of the materials used in this study use corrosion inhibitors in their manufacture, an experimental assessment has been made as to the long-term efficacy of those inhibitors.
The behavior of insulation materials in the presence of liquid water is a surprisingly complex issue. For example, while the use of hydrophobic materials should be part of any effective CUI strategy, not all hydrophobing agents are created equal. Testing has been carried out to determine the long-term thermal stability of four different non-wetting insulation materials. In addition, all insulation materials have different capacities for holding water, as well as different rates by which they dry-out. This includes even the water-repellent materials, which can become saturated when subjected to aggressive conditions (e.g., prolonged submersion). The greater a material’s holding capacity and the longer its dry-out period, the more risk there is for developing CUI after a wetting event. Experimental and analytical methods have been used to assess both the maximum water capacity and dry-out kinetics for each of these materials. These activities are described below.
Effectiveness of Corrosion Inhibitors
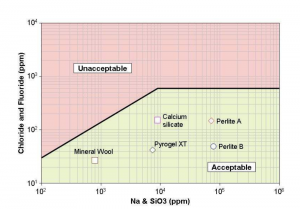
In the event that liquid water penetrates an insulation material, it is important that that material maintain an aqueous chemistry within a specific pH range. Insulation materials with adventitious chloride anions and low pH values can significantly accelerate corrosion rates. To determine the quantity of extractable anions, materials are typically tested according to ASTM C871. 8 Regions of unacceptable and acceptable anion quantities are described by the Karnes curve, shown in Figure 1. 9 As part of this study, independent, third-party testing has been carried out on calcium silicate, mineral wool, Pyrogel XT, and two different brands of expanded perlite. The results are plotted in Figure 1, which shows that all the materials tested passed the requirements of ASTM C795 for extractable anion quantities.
Beyond the extractable anion quantities, the aqueous pH is another critical parameter. The influence of pH on corrosion behavior can be demonstrated by the simplified Pourbaix diagram of REF _Ref251272571 \h Figure 2. These diagrams plot the most thermodynamically stable products as a function of pH and reduction potential. The diagram indicates three distinct regions of interest: 1) immunity, 2) passivation, and 3) corrosion. The regions of corrosion are associated with the oxidation of iron metal to soluble Fe+2 or Fe+3 ions, whereas regions of passivation are associated with the formation of insoluble oxide layers. Likewise, regions of immunity are indicative of the presence of iron metal with no signs of chemical reactivity.
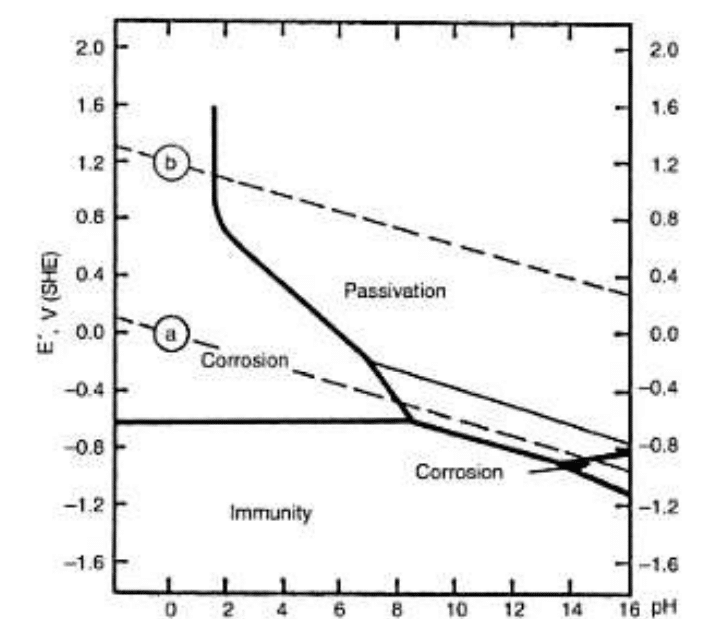
Also plotted in Figure 2 are two dashed lines (a) and (b). These lines represent the EMF potential for the oxidation and reduction of water, respectively. The dashed lines thus bracket the practical region of stability for an aqueous system, outside of which water will begin to decompose. It is evident from the diagram that an aqueous system with a pH value ranging 8 to 13.5 only exhibits regions of immunity and passivation. In other words, corrosion will only occur at pH values lower than 8, and can become severe for pH < 4.
In order to prevent corrosion of carbon steel from occurring, insulation manufacturers will often incorporate highly soluble alkaline modifiers to ensure that the resulting pH values of any absorbed water are above 8.0. For instance, both calcium silicate and perlite contain high levels of sodium silicate and exhibit extractable pH values of ~10.5. Both of these materials thus exhibit excellent corrosion performance when tested in their pristine state, according to ASTM methods (ASTM C1617, C795, etc). The efficacy of sodium silicate as a corrosion inhibitor is derived mainly from its extraordinarily high solubility in water (> 0.78g/mL), which is comparable to that of table salt. The performance of newly manufactured materials is, however, not necessarily a good representation of long-term performance in the field if frequent or prolonged exposure to water is expected. One may surmise that the efficacy of highly soluble corrosion inhibitors diminishes upon repeated and/or continuous water exposure, and that the ability of these materials to resist changes to pH is compromised over time.
Pyrogel XT uses a more durable, magnesium-based corrosion inhibitor with a much lower solubility in water (0.062g/mL at 25°C). Yet, despite the low solubility, it is highly capable of maintaining an aqueous pH value above 8.0, ensuring that the insulation environment is consistently in a region of stability associated with passivation or immunity (refer to Figure 2).
To understand the durability of the various inhibitors, a series of aqueous extraction studies were carried out. Bulk samples of calcium silicate, Pyrogel XT, and two brands of perlite were subjected to constant flow conditions using 6 L of deionized water at a variety of temperatures. The chemistry of the water was sampled hourly and measured for Mg or Na content using emission spectroscopy. The percentage of inhibitor extracted was determined by using a gravimetric conversion factor and by knowing the total quantity of inhibitor present prior to testing. The fraction of inhibitor depletion could thereby be determined under simulated deluge conditions.
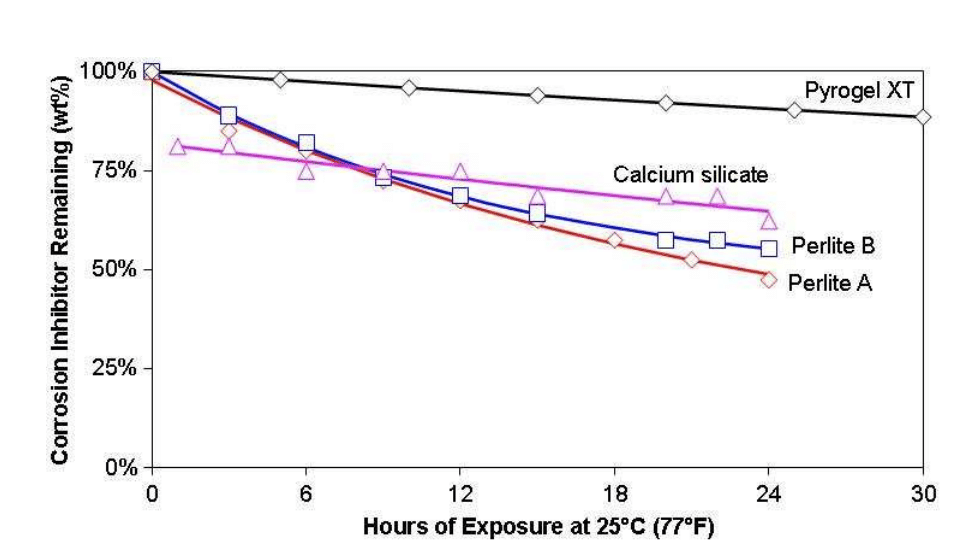
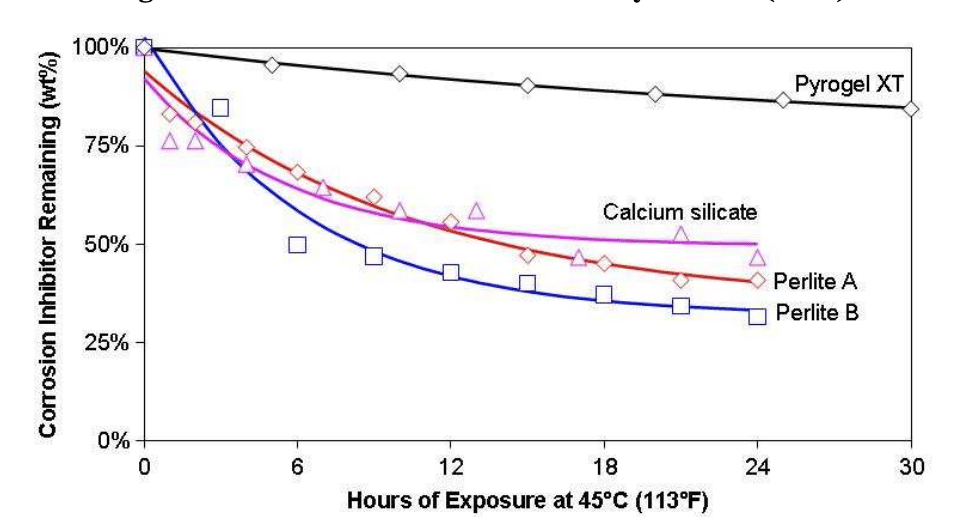
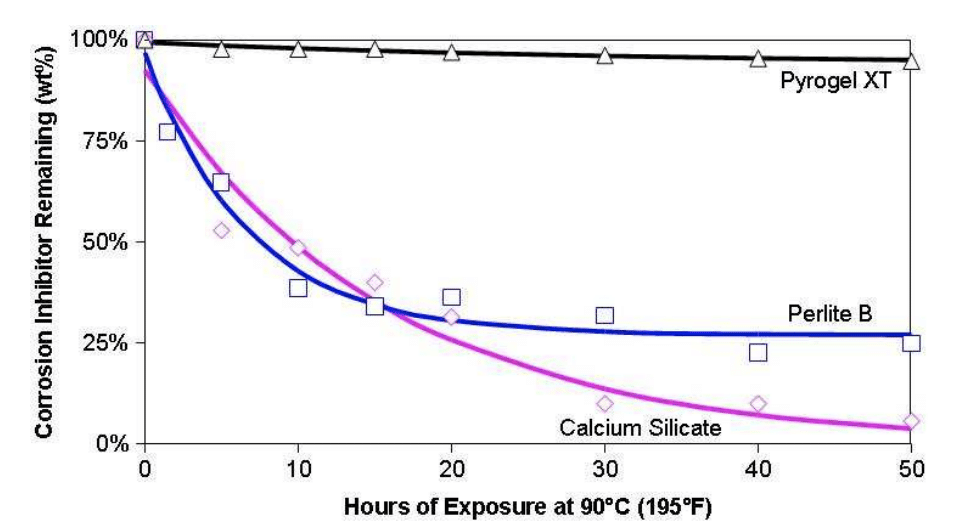
The results are shown in Figure 3, Figure 4 and Figure 5 as the percent of corrosion inhibitor remaining in the insulation over time at 25, 45 and 90°C (77, 113, and 195°F), respectively. Materials employing sodium silicate lost much or most of their corrosion inhibitor after just 24 hours exposure. After 48 hours at 90°C, the perlite and calcium silicate retained only 25% and 5% of their inhibitor, respectively, while Pyrogel XT retained 94%.
This testing points to a potential discrepancy between the aqueous chemistry of pristine materials (as they are tested in C692 and C1617) and in-service materials, and validates field measurements reported previously in the literature. At a minimum, one can infer that the pH values of materials inhibited with sodium silicate may drift downward over time with continuous or repeated exposure to water, potentially leading to an increase in the risk for CUI. In contrast, the pH values beneath Pyrogel XT should be more stable over time.
Hydrophobe Durability
Hydrophobicity is the tendency of a material to repel rather than absorb liquid water. Of the five water-repellent materials included in this study, four (WRG mineral wool, Pyrogel XT, and two brands of expanded perlite) achieve their water-repellency with chemical additives that make them resistant – though not impervious – to water’s natural capillary action. The fifth, cellular glass, is a closed-cell material that is inherently resistant to liquid water so long as the cell structure remains intact (i.e., without cracks, punctures, or unsealed joints).
All known hydrophobing agents are organic in nature, and will therefore degrade via oxidation. The rate of this degradation, R, depends on temperature via the Arrhenius relation:

where T is absolute temperature, and A and B are empirical constants. In other words, the higher the exposure temperature, the shorter the lifetime of the hydrophobe, and the greater the risk for CUI.
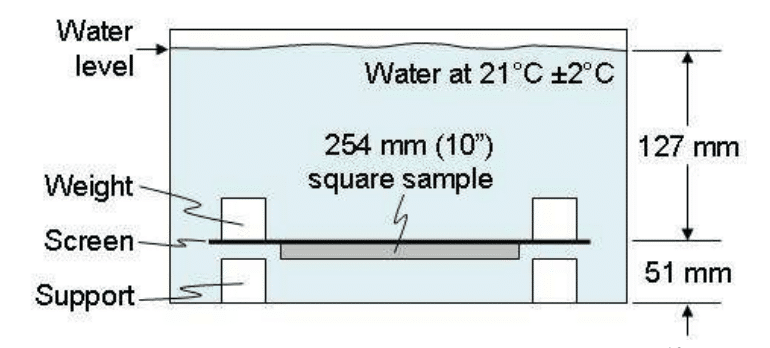
To better understand these limits, an assessment was made of hydrophobe stability at various temperatures. Sample coupons of WRG mineral wool, Pyrogel XT, and two brands of expanded perlite were baked in ovens at temperatures ranging from 300 to 430°C (572 to 806°F) for up to 385 days. Periodically, the coupons were removed, cooled to ambient temperature, tested for water uptake, and then returned to the oven. Water uptake was assessed according to the method of ASTM C1511, whereby a sample is submerged under 127 mm (5 in.) of water for 15 minutes (see Figure 6). The sample’s weight is measured both before and after submersion, and the weight uptake is reported as the percent increase over the dry weight of the sample.
Representative data from such testing is shown in Figure 7, which plots the water uptake of each sample as a function of the total time of aging at, in this case, 300°C. Also plotted in Figure 7 is a failure threshold of 25wt% (dashed line). Although this value is somewhat arbitrary, having a defined threshold is necessary for predicting the useful hydrophobe lifetime.
There are several interesting things to note about the data in Figure 7:
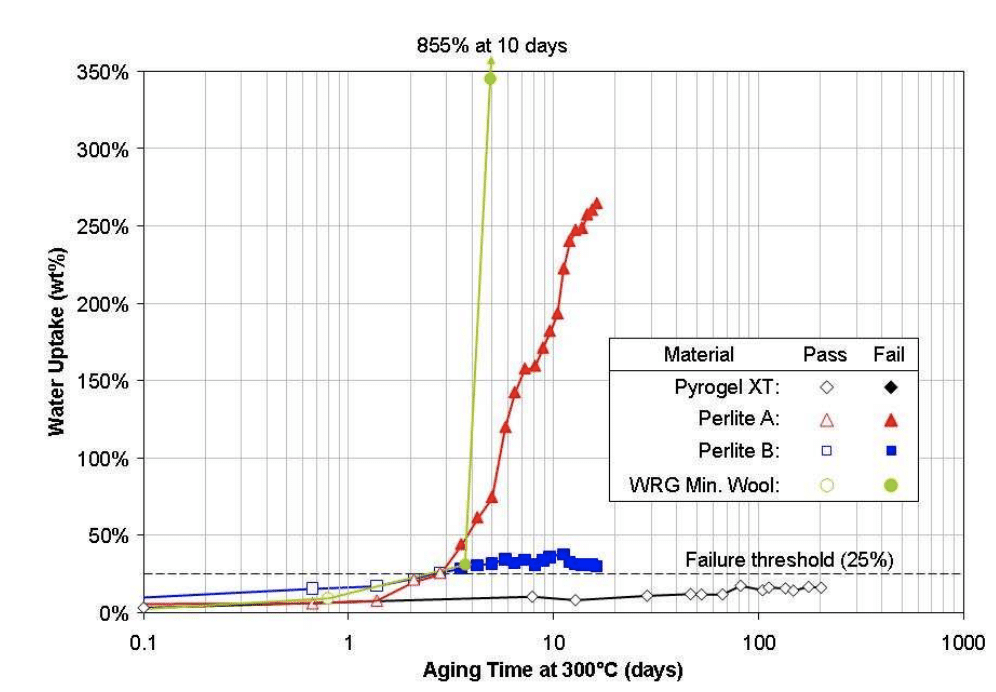
The WRG mineral wool and perlite A samples fail much more catastrophically than the perlite B sample or, for that matter, the Pyrogel XT sample, which hasn’t failed at all after 200 days. The WRG quickly soars to its saturation value of 855% uptake after 10 days exposure. The perlite A sample degrades to 264% uptake after 16 days. The perlite B stabilizes near 33% uptake after the first 4 days of exposure.
The WRG mineral wool and both perlite samples all cross the failure threshold after about 3 days exposure. This is to be expected, as the hydrophobicity of these three materials is imparted via a coating process involving the use of aqueous silicone (polydimethylsiloxane) emulsions. Controlled thermogravimetric analyses have shown that polydimethylsiloxane will, when heated in air for 5 hours, exhibit a 15% degradation at 300°C and 85% degradation at 350°C.
The Pyrogel XT shows very little hydrophobe loss over the 200 days studied. Again, this performance is tied to hydrophobe chemistry which, in the case of Pyrogel XT, is based on a highly crosslinked methylsiloxane resin. This proprietary treatment is covalently bonded to the aerogel backbone via robust Si-O-Si linkages. The unique thermooxidative stability of the material is thus derived from an increased polymethylsiloxane crosslink density (relative to standard polydimethylsiloxane emulsions) in combination with an integral bonding of the methylsiloxane resin to the material.
The next step for predicting hydrophobe lifetime is to aggregate the water uptake data taken at all the different temperatures. This is shown in REF Figure 8, which plots all the paired sets of exposure temperature and exposure time for each material. By discriminating the samples that have passed (open shapes) from those that have failed (closed shapes), an Arrhenius-based curve fit can be made for the time-to-failure as a function of temperature (solid lines). This curve-fit allows us to predict how long the hydrophobe will remain effective based on the service temperature of the pipe or equipment.
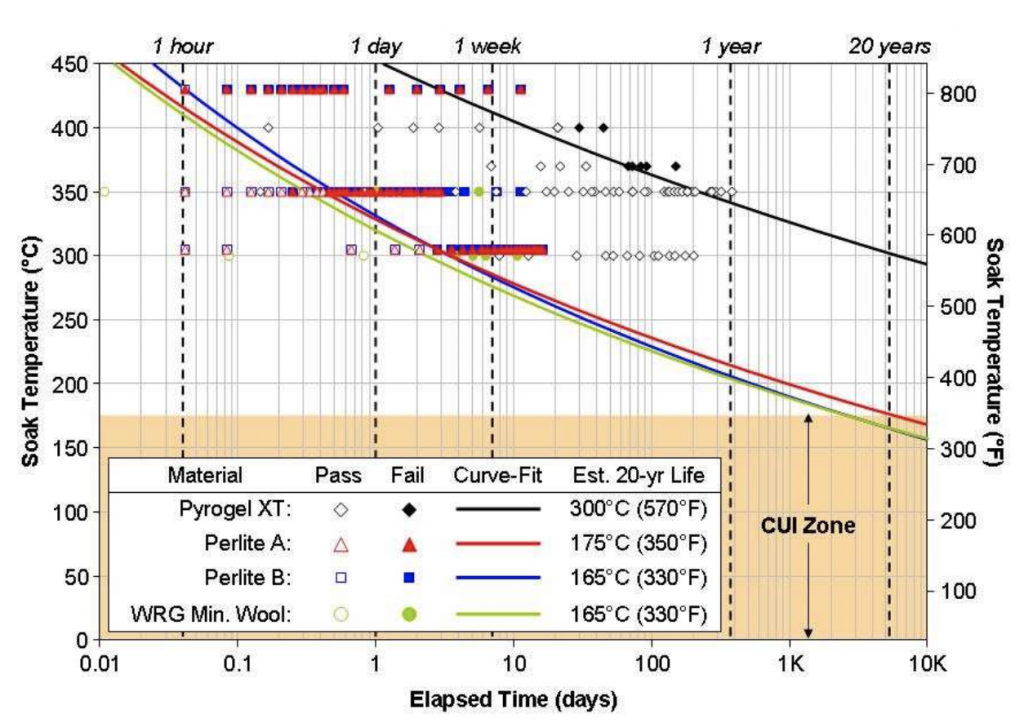
By establishing a 20-year hydrophobe lifetime as the relevant metric of performance, a prediction can be made as to the maximum temperature for which that lifetime can be achieved. The results (inset table, Figure 8) show that the WRG mineral wool and two brands of perlite cluster together at a 20-year survivability temperature of 165 to 175°C (330 to 350°F). Again, this clustering is to be expected since all three products are based on the same polydimethylsiloxane hydrophobe chemistry. Pyrogel XT, being based on the more stable crosslinked methylsiloxane resins, should remain water repellent for 20 years at service temperatures up to 300°C (570°F).
These results show that all four hydrophobic materials should remain water repellent over their useful life when used within the typical CUI range (-4 to 175°C). However, even at temperatures above the CUI range, hydrophobicity can still be an important ally for protecting the substrate during low-temperature cycles or shutdowns. It can also help prevent the inevitable loss of thermal efficiency that results from water ingress into the outer, cooler layers of insulation.
For example, a delayed coker unit cycling between 480 and 93°C (900 to 200°F) could be insulated with 150 mm (6 in) of WRG mineral wool, 60 mm (2.4 in) of Pyrogel XT, or 190 mm (7.5 in) of expanded perlite. Because of the high service temperature, any organic constituents (e.g., hydrophobe, mineral wool binders) near the hot-face will quickly oxidize and burn out. The depth of the burn-out region is dependent on the volatility of those organics and the shape of the material’s thermal conductivity curve. This is illustrated in Figure 9, where the mineral wool would be expected to become hydrophilic through the innermost 126 mm (84%). Expanded perlite would lose 152 mm (80%) of its water repellency. Pyrogel XT would lose only the inner 32 mm (53%) of hydrophobicity.
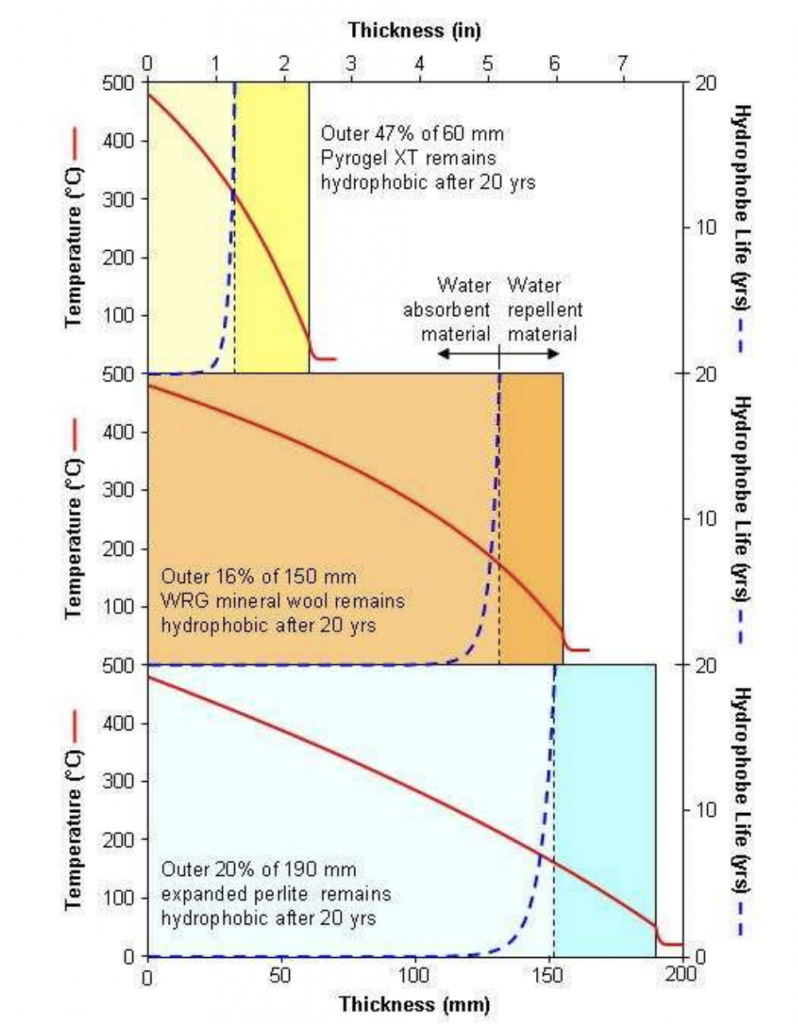
Understanding this behavior is particularly important for coker applications because of the prevalence of liquid water and steam in these units, and because of the energetic nature and scale of the process. Any loss in insulation thermal efficiency due to water ingress can be extremely expensive in energy losses over the life of the drum.
Maximum Water Uptake
Given sufficient time and water pressure (e.g., flooded conditions), even hydrophobic insulation materials can become saturated. To assess the performance of various materials under these extreme conditions, a modified version of ASTM C1511 (refer to Figure 6) was employed whereby the coupons were left submerged for as long as 17 weeks rather than the specified 15 minutes. Typical results for hydrophobic materials are shown in Figure 10. For wetting materials, saturation is reached too rapidly to be shown on such a long axis, but the maximum water uptake values measured for all materials are given in Table 1.
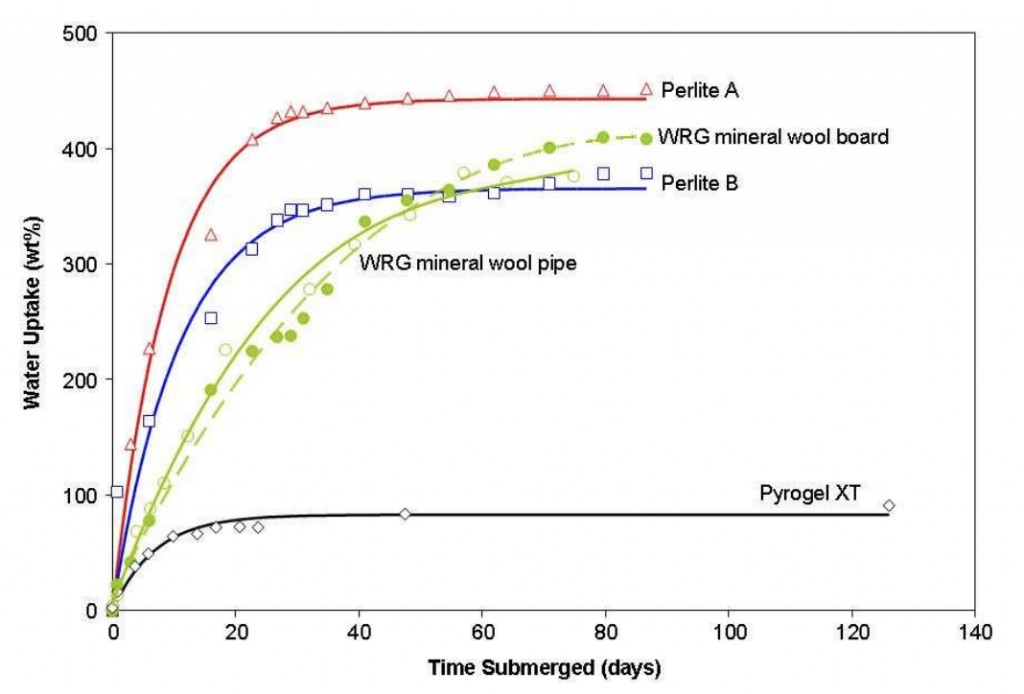
| Material Type |
Dry Density kg/m3 (lb/ft3) |
Maximum Water Uptake, wt% |
| Pyrogel XT | 170 (10.6) | 90% |
| Calcium silicate | 232 (14.5) | 350% |
| Expanded perlite A | 208 (13.0) | 452% |
| Expanded perlite B | 208 (13.0) | 379% |
| WRG mineral wool | 128 (8.0) | 490% (855%)* |
| Mineral wool | 128 (8.0) | 700% (1000%)* |
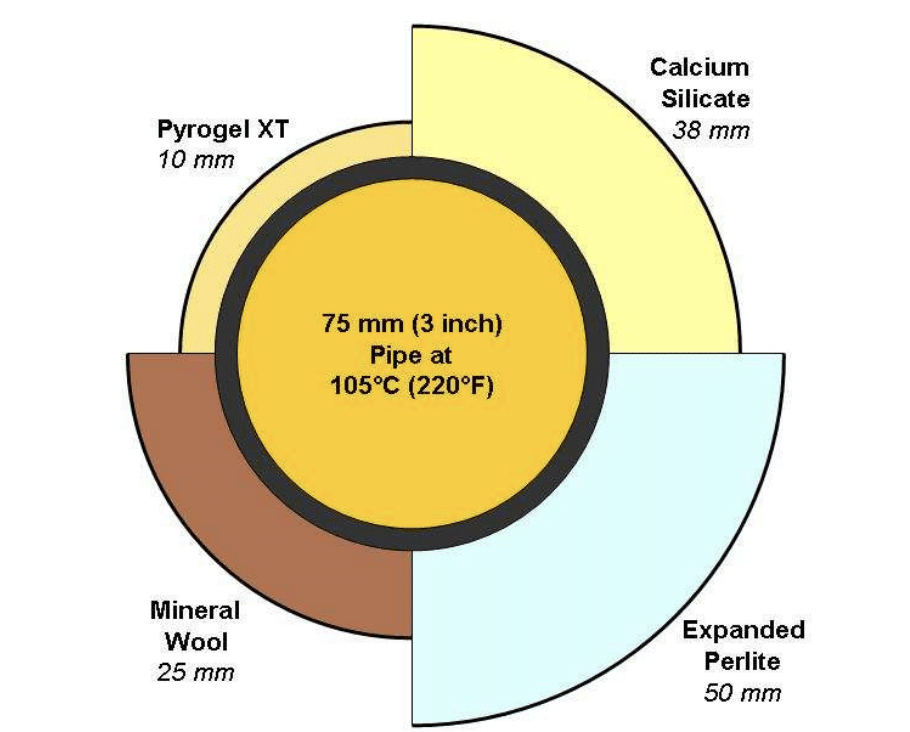
However, the results in Figure 10 and Table 1 don’t tell the whole story because the “weight-percent” metric obscures the fact that different materials have different densities and thicknesses and, therefore, different starting or “dry” weights. Take for example, a 3” pipe operating at 105°C (220°F), typical of condensate service and squarely in the heart of the CUI danger zone. A typical facility might insulate this piping with one of the materials illustrated in Figure 11. If that line is located in a trench that sees winter flooding, what would the post-flooding water uptake look like for each of these materials? The answer is shown in Figure 12, which charts the dry weight, wet weight, and total weight for each of the various insulation materials.
weight (wet + dry) is noted above each column.
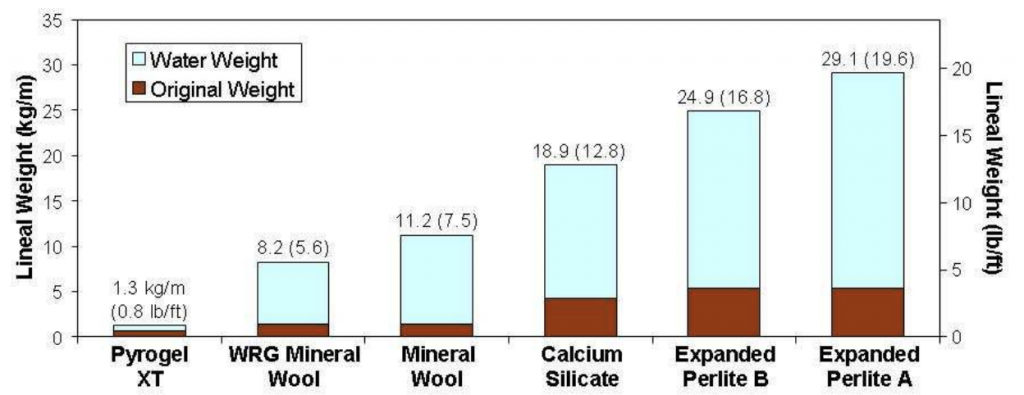
weight (wet + dry) is noted above each column.
The potential for dramatic weight increase raises a number of issues for the designer. The first is structural. Shoe spacing for a 3” condensate line would typically be based on the lineal weight when the line is full – 17.4 kg/m (11.7 lb/ft) – plus the dry weight of the insulation. In a post-flooding scenario, water uptake can exceed the design weight value by as little as 3% for Pyrogel XT, or as much as 104% for one brand of expanded perlite. The additional weight, if unaccounted for, could potentially overstress the pipe, shoes and surrounding structure.
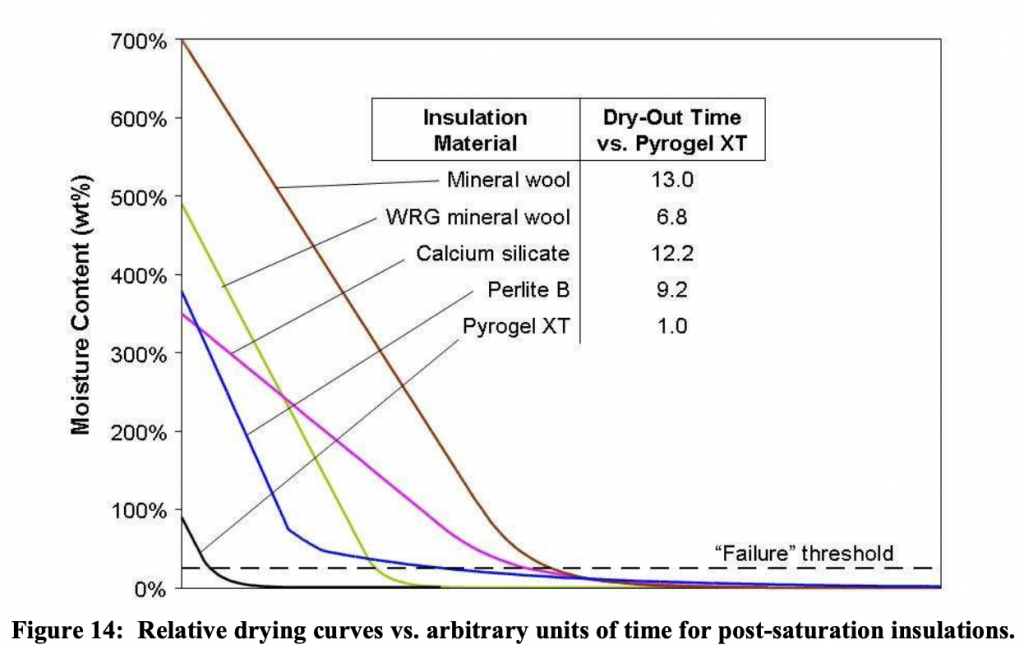
The second issue concerns dry-out. The greater the level of saturation, the longer it takes to dry the insulation. If the dry-out period is longer than the typical time between saturation events, it is quite possible that the insulation will never completely dry and would, therefore, be a likely spot for CUI to develop. This issue is explored in greater detail below.
Dry-out Kinetics
Drying-rate curves for porous materials generally exhibit two distinct regions of behavior. Figure 13 illustrates the relationship between water content (X) and drying rate ( EMBED Equation.3 ) for a non-reacting porous solid. The first drying region occurs after a brief warm-up period, when moisture is removed at a constant rate because a film of liquid water persistently exists at the surface of the material. Because the surface mass transfer rate is the controlling resistance, the drying rate during this period is independent of material type. At a certain critical moisture content (Xcr), the drying rate begins to fall as the material’s internal transport mechanisms begin to dominate the overall resistance to mass transfer. During this period, the surface of the material becomes partially unsaturated until it reaches the equilibrium moisture content (Xeq) for that specific drying condition (i.e., temperature, RH, air velocity).
The average dry-out rate for an insulation is highly dependent on that material’s critical moisture content. Those materials that exhibit a very low Xcr will have extended periods of constant-rate drying, and will thus dry very quickly. With that in mind, a series of experiments were conducted to determine the drying rate curves and critical moisture contents for calcium silicate, Pyrogel XT, mineral wool, WRG mineral wool, and expanded perlite. This effort utilized a temperature controlled moisture balance and a controlled gas flow rate to determine the dry-out rates for water-saturated materials at exposure temperatures of 75, 100, 150 and 200°C (167, 212, 302 and 392°F). By monitoring the moisture content over time, the inflection point in the drying rate curve and, therefore, the critical moisture content could be determined. The results are shown in Table 2.
| Material Type | Temperature (°C) | |||
| 75 | 100 | 150 | 200 | |
| Mineral wool | 0.75 | 1.00 | 0.50 | 0.50 |
| Calcium silicate | 0.65 | 0.78 | 0.87 | 1.00 |
| Pyrogel XT | 0.45 | 0.34 | 0.35 | 0.36 |
| WRG mineral wool | 0.30 | 0.34 | – | 0.41 |
| Expanded perlite | 0.88 | 0.72 | 0.68 | 0.66 |
Because these values were determined under identical conditions for each given temperature, comparison of the values affords a relative measure of drying kinetics. In general, the hydrophobic materials (WRG mineral wool, Pyrogel XT) exhibit the lowest critical moisture contents, while hydrophilic materials (mineral wool, calcium silicate) exhibit high values. Unexpectedly, hydrophobic perlite also exhibited elevated critical moisture content values, suggesting that this particular material exhibits comparatively poor drying kinetics.
Once the critical drying rate is determined for a particular material, it is possible to determine the time necessary to reduce the moisture content from X1 to X2 according to:
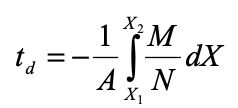
where Ms is the material mass, A is the surface area, and N is the drying rate. Although absolute drying times are highly specific to actual drying conditions, the relative drying times among materials exposed to similar environment will be fairly consistent. Figure 14 illustrates just this, plotting the various material drying curves against arbitrary units of time. This shows that mineral wool is the slowest material to dry, while Pyrogel XT is the fastest. The spread between the two is such that if it takes Pyrogel XT one day to dry, an equivalent thickness of mineral wool would require 13.0 days. Beyond Pyrogel XT, WRG mineral wool is the next fastest to dry (6.8 days to every one for Pyrogel), followed by perlite B (9.2-to-1), and calcium silicate (12.2-to-1).
12-Week Accelerated Corrosion Tests
A study was performed to gauge the level of corrosion that occurs beneath insulation materials on uncoated, carbon steel pipe when exposed to the elements. As pictured in Figure 15, two pipe stands, each with two 150 mm NPS x 2.4 m (6 in NPS x 8 ft) horizontal pipes, were placed outside in Northborough, MA, during the late spring and summer of 2009. Each pipe was covered with sections of insulation of various types, with each insulated section measuring 600 mm (2 ft) long and separated by 150 mm (6 in) of bare steel. Each of the insulation sections were fastened onto the pipe with two 13 mm (½ in) stainless steel bands.
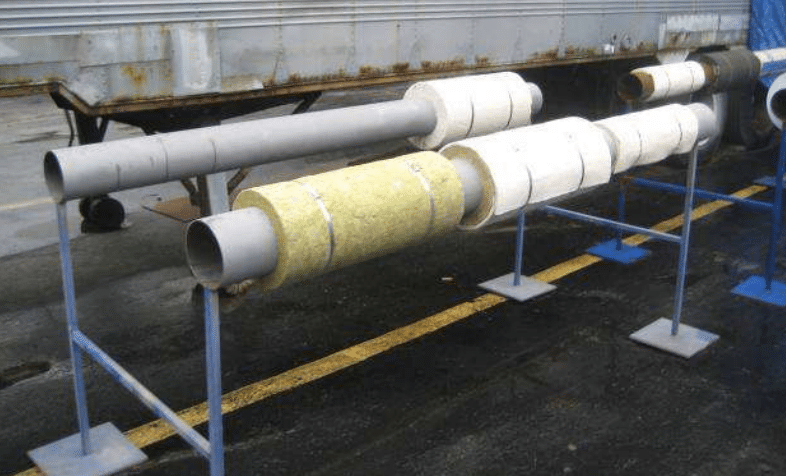
All the insulation test sections were left unjacketed to simulate worst-case environmental exposure. This would be similar to conditions of periodic submersion, or where the jacketing was ripped open by high winds or mechanical abuse. All two-piece pipe sections were arranged with a vertical seam to accelerate water infiltration and exfiltration.
The insulation materials and thicknesses that were tested are shown in Table 3. Every effort was made to normalize thicknesses on the basis of delivering equivalent thermal performance (i.e., resistance to radial heat transfer) but, because of the digital nature of insulation thicknesses, the correspondence is necessarily rough (±15%). In addition to the seven basic material types, one insulation composite (Pyrogel XT over mineral wool) was also tested.
| Test ID |
Insulation Material |
Thk mm (in) |
Lineal R-Value* m-°C/W (hr-ft-°F/Btu) |
Test Stand |
| 1 | Cryogel Z | 15 (0.6) | 1.75 (3.03) | 1 |
| 2 | Cellular glass | 50 (2.0) | 1.86 (3.23) | 1 |
| 3 | Expanded perlite | 75 (3.0) | 1.52 (2.63) | 1 |
| 4 | Mineral wool2 | 38 (1.5) | 1.65 (2.86) | 1 |
| 5 | Pyrogel XT | 15 (0.6) | 1.41 (2.44) | 2 |
| 6 | Calcium silicate | 64 (2.5) | 1.56 (2.70) | 2 |
| 7 | WRG mineral wool3 | 38 (1.5) | 1.65 (2.86) | 2 |
| 8 | Pyrogel XT over Mineral wool2 |
10 (0.4) + 38 (1.5) |
2.31 (4.00) | 2 |
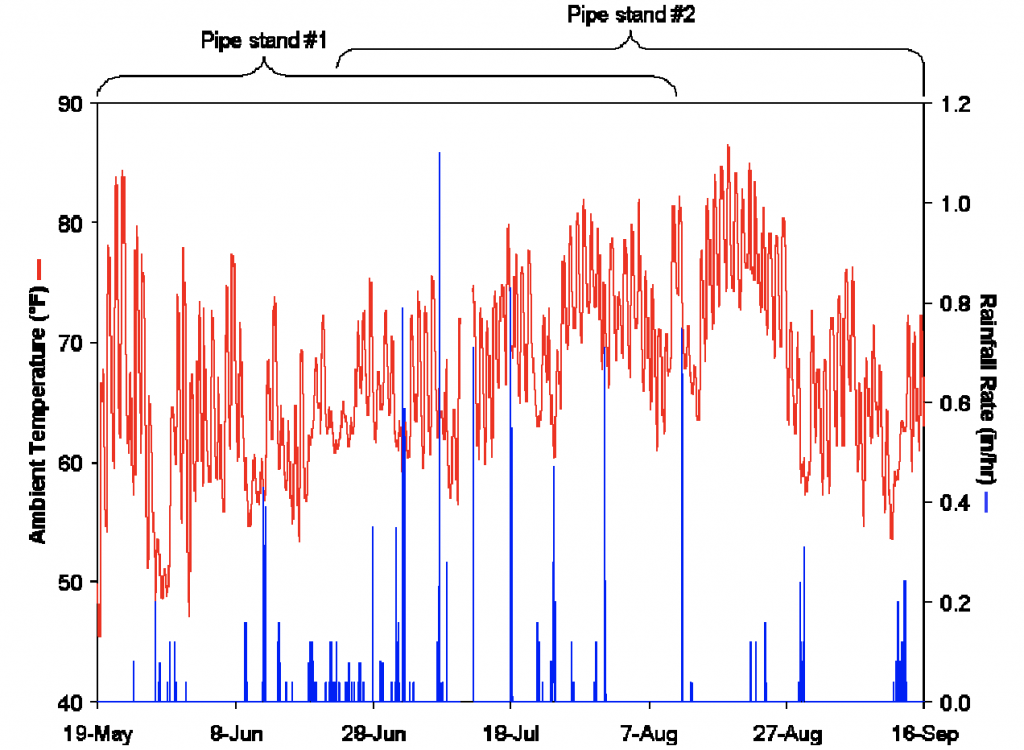
The period of exposure occurred during one of New England’s wettest summers on record. As shown in Table 4, each pipe stand experienced dozens of precipitation events and 42‑46 cm (16.5‑18.0 in) of total rainfall. The mean time between precipitation events, or dry-out period, averaged just over two days. The rainfall and temperature pattern during this time is plotted in Figure 16. Note that at no point did the ambient temperature drop below 0°C (32°F), so any degradation phenomena were clearly not the result of freeze-thaw mechanics.
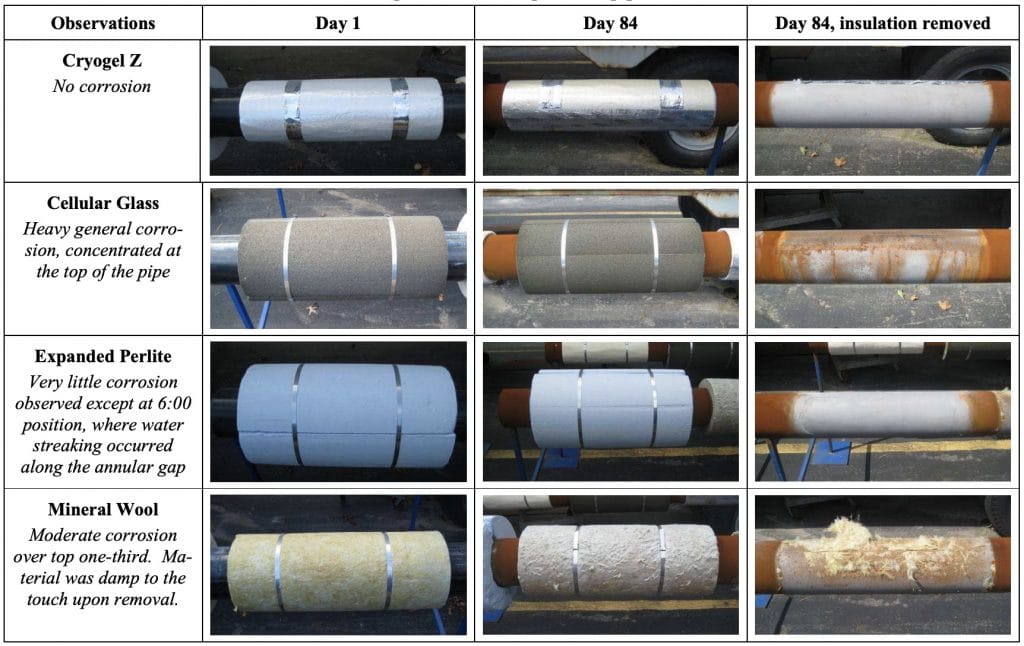
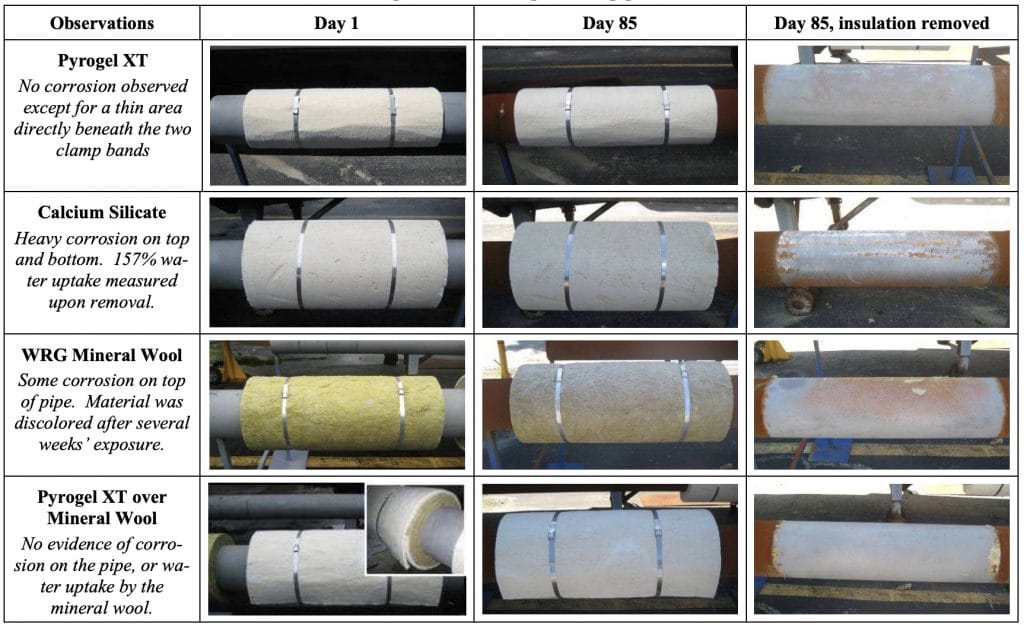
After several months of exposure, the insulation test sections were removed from the pipes. The exposed pipe surface was then photographed for a qualitative measure of the extent and severity of corrosion under insulation. The results for each test section are discussed below and pictured in Table 5 and Table 6.
| Pipe Stand | #1 | #2 |
| Test Period | 19-May – 11-Aug | 22-June – 15-Sept |
| Total Days of Testing | 84 | 85 |
| Avg. Ambient Temperature | 18.7°C (65.6°F) | 20.6°C (69.1°F) |
| Avg. Relative Humidity | 67% | 69% |
| No. of Precipitation Events | 43 | 36 |
| Mean Time Between Events | 47 hrs | 57 hrs |
| Cumulative Rainfall | 45.7 cm (18.0 in) | 42.0 cm (16.5 in) |
1. Cryogel Z
The Cryogel Z area was the cleanest of all the test sections, with no visible corrosion beneath the insulation. This was as expected because the factory-applied mylar vapor barrier provided an impermeable rain screen. The only possible route of water ingress was via the edges, but that was effectively shut off by the aerogel’s natural hydrophobicity, and its ability to be wrapped tightly with no gaps. The only exception to this was the small area where the second layer of material lapped over the first, leaving a small triangular tunnel between the insulation and the pipe. At that location, a small amount (6 cm2, or 1 in2) of edge corrosion is seen on either side of the test section.
2. Cellular Glass
The pipe beneath the cellular glass insulation showed the highest level of CUI. The corrosion was concentrated most heavily at the top of the pipe, on either side of where the rainwater penetrated the vertical seam between the two half-shells, as pictured in REF _Ref250395575 \h Figure 17. The most likely explanation for this phenomenon is that a small volume of rainwater, upon entering the system, becomes trapped within a thin, wedge-shaped space bounded by the pipe wall, the impermeable insulation material, and a thin meniscus (see Figure 17, inset).
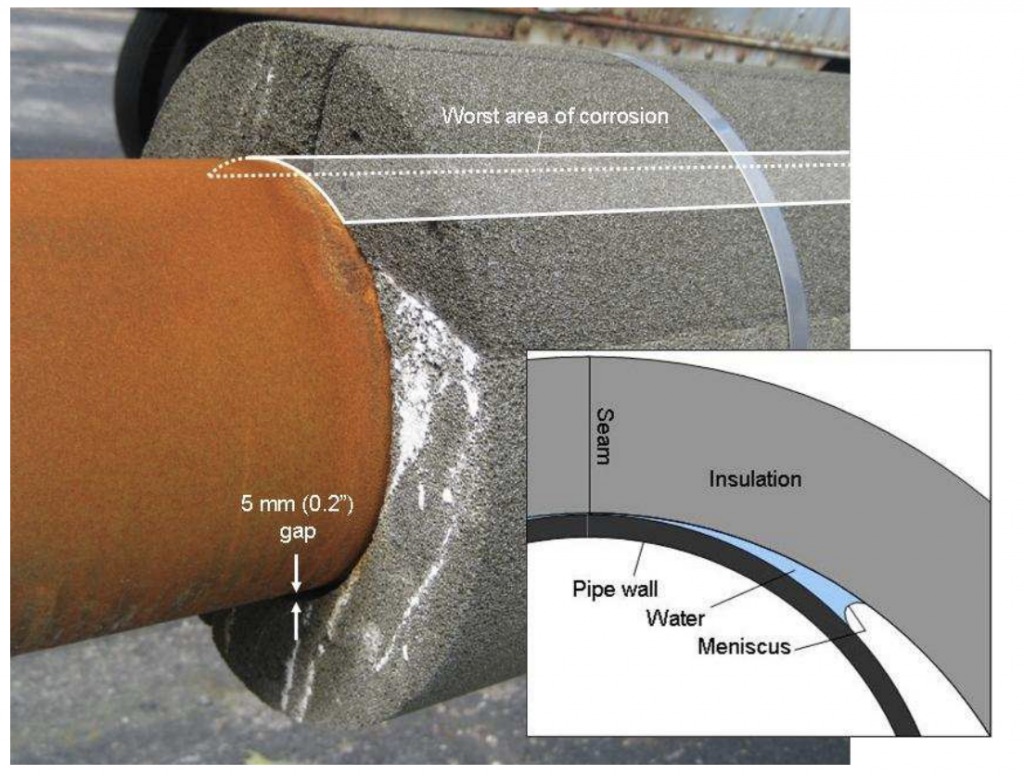
This phenomenon illustrates the double-edged sword of using closed-cell materials like cellular glass in hot work. Because they shut off the natural pathways for liquid- and vapor-phase migration, they’re nearly as effective at keeping water in as they are at keeping it out.
3. Expanded Perlite
The expanded Perlite showed almost no corrosion after the insulation was removed. The only area that showed any significant rust was a thin line running along the 6-o’clock position. Here, rainwater would enter from the side following a slight grade, and run along the bottom of the pipe, through the annular space. Otherwise the surface was nearly pristine after 84 days of continuous exposure, owing primarily to this material’s intrinsic hydrophobicity.
4. Mineral Wool
After 84 days of direct exposure to the elements, the surface of the mineral wool insulation was quite weathered and the material was damp to the touch. Upon removal, the surface corrosion was observed to be concentrated on the top of the pipe. Here the mechanism is slightly different than with the cellular glass. Rather than forming a wedge shaped space for water to reside in, the fiber simply absorbed the rainfall and thereby provided a nearly constant source of water to the pipe’s upper surface, despite periodic dry-out periods.
5. Pyrogel XT
Pyrogel XT showed very little evidence of corrosion upon removal from the pipe. The only areas of discoloration were mild and were concentrated at the top of the pipe, directly beneath each of the bands.
6. Calcium Silicate
Over the 85-day exposure, the calcium silicate – which had begun at a weight of 6.3 kg (14 lbs) – had absorbed an additional 10.0 kg (22 lbs) of water, for a final water uptake of 157%. The pipe surface under the calcium silicate had also taken on an unusual rust pattern. It had significant corrosion along the bottom one-third (roughly 4-o’clock to 8-o’clock) of the pipe. While this was the opposite of the corrosion pattern of the cellular glass, it should be noted that the fit between the calcium silicate and the pipe was much tighter. Also, because the calcium silicate is porous, absorbed water would naturally tend to congregate near the bottom of the pipe.
There were also four longitudinal bands of corrosion along the top of the pipe (see picture in Table 6). Although high spots along the insulation ID are suspected, the magnitude was smaller than could be resolved with the naked eye, so the reasons for the patterning remain unresolved.
7. Mineral Wool, Water-Repellent Grade
Water-repellent mineral wool performed much better than untreated mineral wool, but still showed some mild corrosion along the top one-third of the pipe. The color of the material changed significantly over the course of the test, possibly indicating some sort of chemical change in the binder.
8. Pyrogel XT Over Mineral Wool
The composite design of Pyrogel XT over mineral showed zero evidence of corrosion after 85 days, and the mineral wool had not absorbed any water. Note that this result validates the findings of previous laboratory experiments done by a major oil company in The Netherlands. That study found that, of eight different pipe insulation systems exposed to 80°C (176°F) process temperatures and a constant salt-water drip, only Pyrogel XT and Pyrogel XT over mineral wool were found to be free of corrosion after 90 days.
Conclusions
The roles that different insulation materials play in CUI can be complex. This study is an attempt to move beyond the simple categories of wetting and non-wetting materials, and identify quantifiable metrics that can be useful to the insulation system designer. These metrics include the durability of corrosion inhibitors, the thermal stability of hydrophobing agents, the maximum water uptake values, and the dry-out kinetics of specific materials. The results are summarized in Table 7, which scores the performance of each material on a scale of 1 to 5.
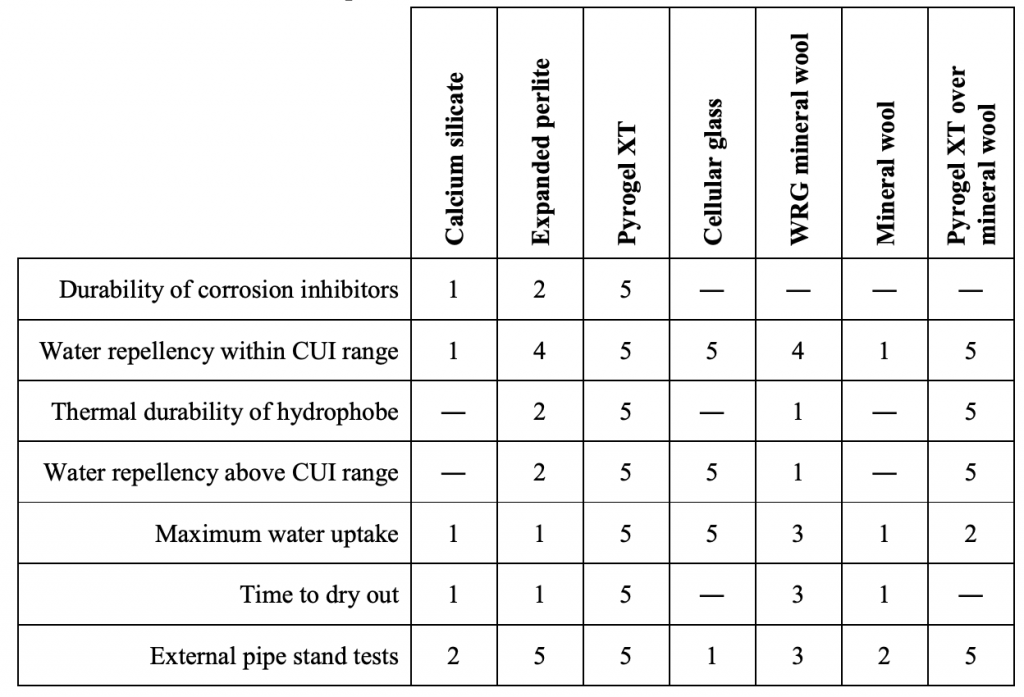
particular value was not tested.
In general, these results validate the conventional wisdom that water-absorbent materials (calcium silicate, mineral wool) help promote CUI, while water-repellent materials (expanded perlite, Pyrogel XT, WRG mineral wool) do not. Hopefully, this study goes a step further by presenting some unique laboratory data, and shining a light on specific insulation degradation mechanisms and the role they may play in CUI.
Acknowledgements
The authors would like to acknowledge the generous support of Dr. Mahesh Jha, of the U.S. DoE’s Energy Efficiency and Renewable Energy office.
References
- “Standard Recommended Practice: The Control of Corrosion Under Thermal Insulation and Fireproofing Materials — A Systems Approach,” NACE Standard RP0198-98, Item No. 21084, 1998.
- Winnik, S., European Federation of Corrosion Publications Number 55: Corrosion-under-insulation (CUI) guidelines, Woodhead Publishing Limited, Cambridge, England, 2008.
- Ashbaugh, W.G. and Laundrie, T.F., “A Study of Corrosion of Steel Under a Variety of Thermal insulation Materials,” Corrosion of Metals Under Thermal insulation, ASTM STP 880, W.I. Pollock and J.M. Barnhart, Eds., American Society for Testing and Materials, Philadelphia, 1985, pp. 121-131.
- Sandberg, T., “Experience with Corrosion Beneath Thermal Insulation in a Petrochemical Plant,” Corrosion of Metals Under Thermal insulation, ASTM STP 880, W.I. Pollock and J.M. Barnhart, Eds., American Society for Testing and Materials, Philadelphia, 1985, pp. 71-85.
- Lazar, P., III, “Factors Affecting Corrosion of Carbon Steel Under Thermal Insulation,” Corrosion of Metals Under Thermal insulation, ASTM STP 880, W.I. Pollock and J.M. Barnhart, Eds., American Society for Testing and Materials, Philadelphia, 1985, pp. 11-26.
- “Standard Practice for Inner and Outer Diameters of Rigid Thermal Insulation for Nominal Sizes of Pipe and Tubing (NPS System)”, ASTM C585-90, 2004.
- “Standard Test Method for Evaluating the Influence of Thermal Insulations on External Stress Corrosion Cracking Tendency of Austenitic Stainless Steel”, ASTM C692-05, 2005.
- “Standard Test Methods for Chemical Analysis of Thermal Insulation Materials for Leachable Chloride, Fluoride, Silicate, and Sodium Ions”, ASTM C871-04, 2004.
- “Standard Specification for Thermal Insulation for Use in Contact with Austenitic Stainless Steel”, ASTM C795-03, 2003.
- Talbot, J., Corrosion Science and Technology, pp. 81-144, CRC Press, 1998.
- “Standard Practice for Quantitative Accelerated Laboratory Evaluation of Extraction Solutions Containing Ions Leached from Thermal Insulation on Aqueous Corrosion of Metals”, ASTM C1617-05, 2005.
- Long, V.C., and Crawley, P.G., “Recent Experiences with Corrosion Beneath Thermal Insulation in a Chemical Plant,” Corrosion of Metals Under Thermal Insulation, ASTM STP 880, W.I. Pollock and J.M. Barnhart, Eds., American Society for Testing and Materials, Philadelphia, 1985, pp. 86-94.
- “Standard Test Method for Determining the Water Retention (Repellency) Characteristics of Fibrous Glass Insulation (Aircraft Type)”, ASTM C1511-04, 2004.
- Andrianov, K.A., Metalorganic Polymers, Interscience, New York, 1965, p. 50.
- Mujumdar, A.S., Devahastin, S., “Fundamental Principles of Drying,” in S. Devahastin (Ed.), Mujumdar’s Practical Guide to Industrial Drying, Exergex, Montreal, Canada, 2000, pp. 1-22.
- Chauviere, M. M., Krynicki, J.W., and Richert, J.P., “Managing Cui In Aging Refinery Pressure Vessels,” Paper No. 07566, NACE Corrosion Conference & Expo, 2007.
Click here for more informationClick here for related articles and newsSearch for piping manufacturers in our equipment guide
Sign up for Piping Systems E-Updates
Aspen Aerogels produces flexible aerogel insulation products that provide up to five times better thermal performance than competing materials while offering versatility, space savings, and easy handling. Customers use our products to save money, conserve energy, reduce CO2 emissions, and protect workers. We serve many industries including oil and gas …
Source of Article


