In order for Grafana to be useful, you must first add data sources for it to monitor. Jack Wallen shows you how.

Image: Jack Wallen
Grafana is a powerful network monitoring system that can keep tabs on systems and services on your network. It’s open source, free, and highly flexible. The installation of Grafana is fairly straightforward, especially for those with plenty of Linux experience. If you’ve not already installed the monitoring system, make sure to read: How to install the Grafana Monitoring Tool on Ubuntu 18.04.
With the base system installed, Grafana doesn’t really do anything. Why? Because you’ve not added any data sources. A data source tells Grafana what to monitor and where to monitor. For instance, say you have a MySQL server you need Grafana to watch. In order to make that happen, you have to add that server as a data source.
Let me show you how.
SEE: Network security policy (TechRepublic Premium)
What you’ll need
I’m going to show you how to add the MySQL data source. For this, you’ll obviously need to have Grafana up and running. You’ll also need a MySQL server for Grafana to monitor. However, there is one hitch in this connection. For security reasons, you cannot connect Grafana to a MySQL data source via the root user. Because of this, you’ll need to have a regular user added that has been granted privileges to the database you will monitor.
How to add the MySQL user and grant permissions
If you’ve not added a new user to MySQL and granted that new user the necessary permissions to a database, let me show you how. Log in to your MySQL database server and then gain access to the MySQL console with the command:
sudo mysql -u root -p
From the console, create the new user with the command:
CREATE USER 'USERNAME'@'localhost' identified by 'PASSWORD';
Where USERNAME is the name of the new user and PASSWORD is a strong/unique password for the user.
Once you’ve created the user, you need to give it permission to access the database Grafana will monitor. For this, issue the command:
GRANT SELECT ON DBASE.* to 'USERNAME'@'localhost';
Where DBASE is the name of the database and USERNAME is the name of the user.
Finally, flush the privileges and exit from the console with the commands:
FLUSH PRIVILEGES;
exit
You are now ready to add the MySQL data source. Maybe. If you’re adding a remote MySQL, you must make sure it is set up for remote access. To do that, you can follow my instructions in: How to set up MySQL for remote access on Ubuntu Server 16.04. Until you’ve taken care of that, Grafana won’t be able to connect to the remote MySQL data source.
Note: Instead of using GRANT ALL for the MySQL permissions statement, you must use GRANT SELECT (as shown above).
How to the MySQL data source
Log in to your Grafana instance and click the Add Data Source box (Figure A).
Figure A
” data-credit rel=”noopener noreferrer nofollow”>
The Add Data Source box from the main dashboard.
Scroll down until you see the MySQL entry. Hover your cursor over that entry and then click Select (Figure B).
Figure B
” data-credit rel=”noopener noreferrer nofollow”>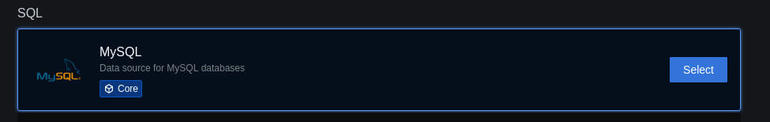
The MySQL entry in the data sources list.
In the resulting window, you must fill out the details for the connection (Figure C). The required entries are:
-
Name – an identifier for the data source
-
Host – the IP address and port of the MySQL database server
-
Database – the name of the database to be monitored
-
User – the user you created that has permissions for the database to be monitored
Figure C
” data-credit rel=”noopener noreferrer nofollow”>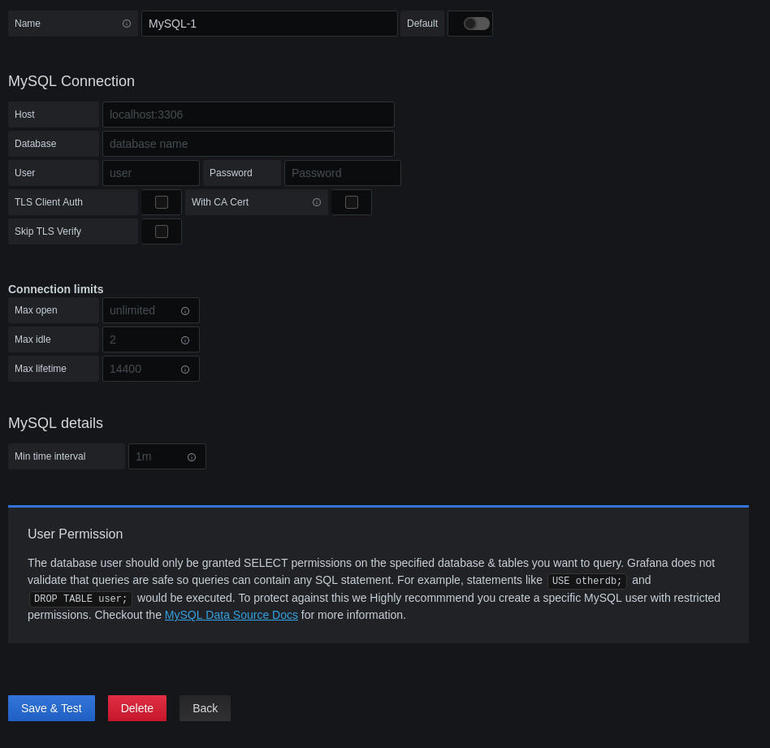
Adding the MySQL data source to Grafana.
You can tweak the other configurations as necessary, but the items above are the only things required to be filled out.
Once you’ve filled out the details, click Save & Test. This should successfully connect to the MySQL data source and save the configuration.
You can then add the datasource to a new dashboard, so that Grafana can start monitoring the database you’ve selected.
Congratulations, Grafana is now doing it’s thing. You can keep a close watch on that datasource to make sure it is functioning as expected.

Open Source Weekly Newsletter
You don’t want to miss our tips, tutorials, and commentary on the Linux OS and open source applications. Delivered Tuesdays
Also see
Source of Article