

When you connect Google Analytics 4 to a Google Site, you obtain a steady stream of information about how visitors behave when they visit your site. Analytics can help you understand how many people visit, which pages they view the most and what path they take through the site. You might use that information to modify navigation or content.
Jump to:
What is Google Analytics 4?
Google Analytics 4 is Google’s most modern website and app analytics offering; it replaced Universal Analytics on July 1, 2023. The tool allows an administrator to analyze how people interact with websites and mobile applications. Analytics can help designers, developers and managers make data-informed changes to sites and apps.
How to set up Google Analytics 4
Open a desktop-class web browser, such as Chrome, on a computer to https://analytics.google.com and sign in or switch to the Google account you wish to use to create and manage your Google Analytics data. The following steps presume you have not yet created an Analytics account.
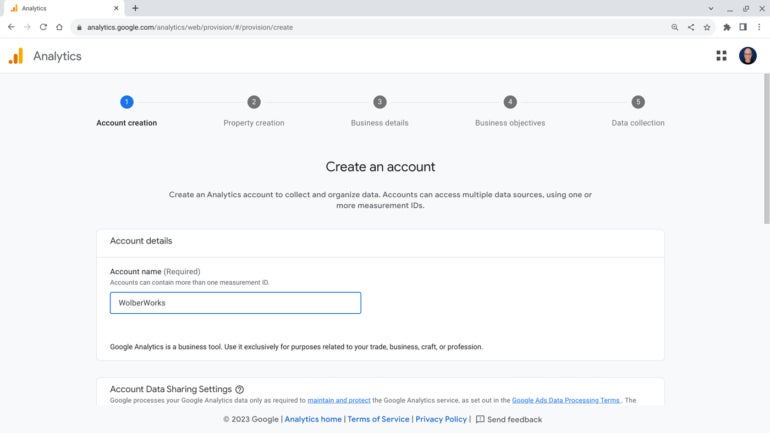
1. Create an account
Enter an account name (Figure A), which could be the name of your business.
You can modify the Account Data Sharing Settings to control whether you wish to allow data sharing with:
- Google products and services.
- Modeling contributions and business insights.
- Technical support.
- Account specialists.
After you complete this step, scroll to the bottom of the screen and select the Next button.
Figure A
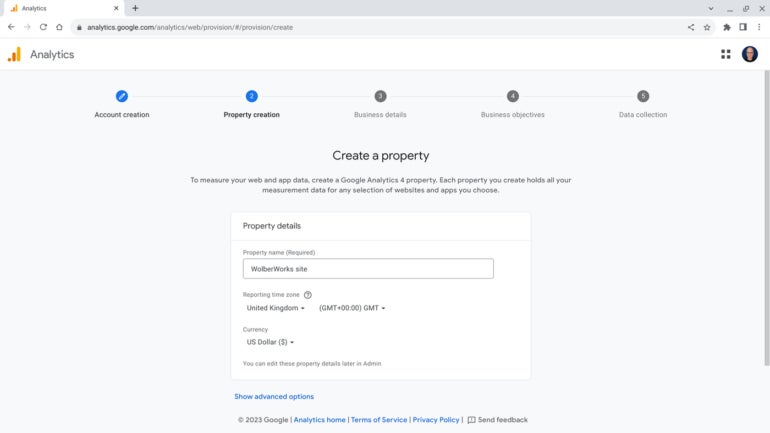
2. Create a property
In this instance, think of a property as a distinct resource that can hold analytics data. To create a new property, enter three pieces of data: Property Name, Time Zone and Currency (Figure B).
- Property name: A property can gather data not only for a website but also for apps. Typically, a property name might be related to a specific brand, product, line or website name. While a property may gather data for a single site, it may also do so for several sites and apps.
- Time zone: For a small business, this might be the time zone of the business location. For a large business with many locations around the globe, you might consider using GMT (e.g., United Kingdom GMT), also known as UTC, to simplify and standardize comparisons across properties in different places.
- Currency: Select the relevant currency for the property. (No cryptocurrencies such as Bitcoin are supported.)
Scroll to the bottom and select Next to proceed.
Figure B
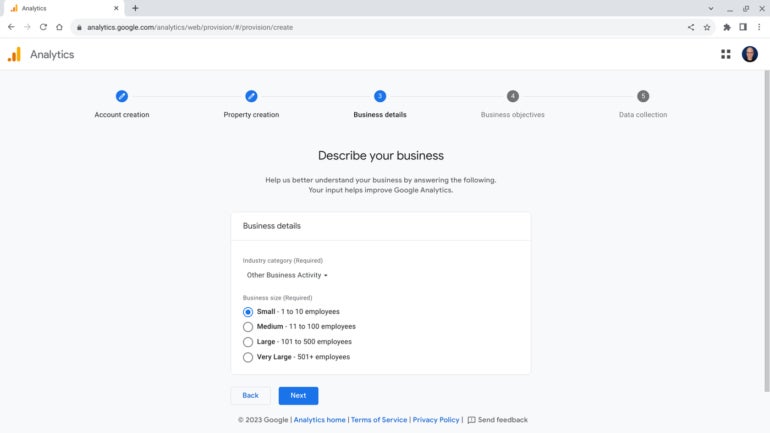
3. Describe your business
Select an Industry Category from the drop-down list and select a Business Size (i.e., Small, Medium, Large or Very Large). Both entries are required (Figure C). Enter the data, and then select Next.
Figure C
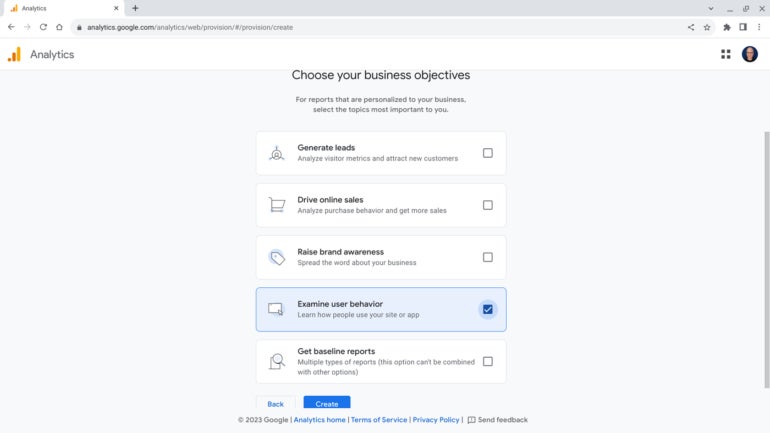
4. Choose your business objectives
Select at least one of the topics (Figure D) to help personalize analytics reporting. While you may select any of the first four in any desired combination, the last option, Get Baseline Reports, cannot be selected with any other item. Select from:
- Generate leads.
- Drive online sales.
- Raise brand awareness.
- Examine user behavior.
- Get baseline reports.
Select the Create button to continue. If prompted, review the presented terms and conditions, and then, if you agree, select the appropriate checkboxes and the I Accept button.
Figure D
5. Add a data stream
Next, you may specify a data stream. In this case, select Web (Figure E) since we plan to analyze data from a website. (You may select Android App and iOS App if you also need to analyze data from apps; the configuration of those details is outside the scope of this article.)
Figure E
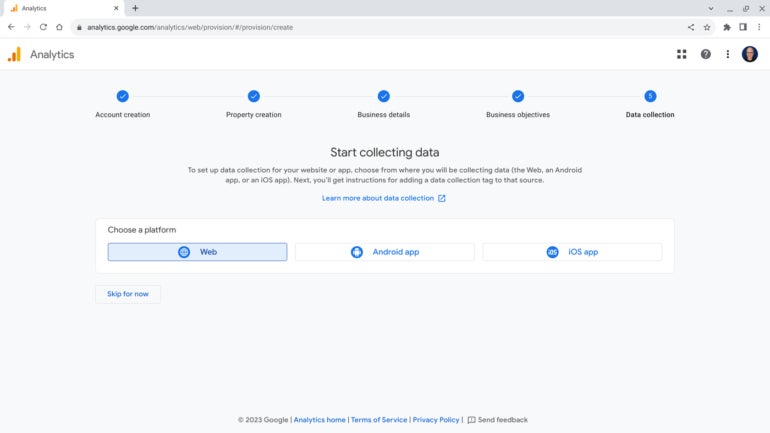
Choose one or more platforms. To track analytics for a Google Site, select Web.
In the panel that displays, enter your website URL and a corresponding stream name (Figure F). Optionally, you may also choose whether to leave the Enhanced Measurement slider enabled. For the greatest insight into behavior on your site, leave this slider on; if your site might convey personally identifiable sensitive information, you might want to turn it off.
Figure F
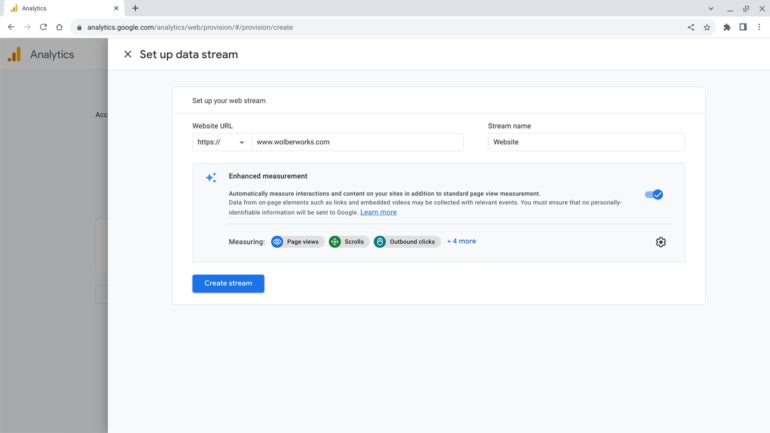
Select the Create Stream button to complete this phase of the Analytics setup.
The system will display the details for the web stream you just created, including the website name and URL, along with the Stream ID and Measurement ID (Figure G). You will need the Measurement ID in the next step, so you may want to write it down or copy it.
Figure G
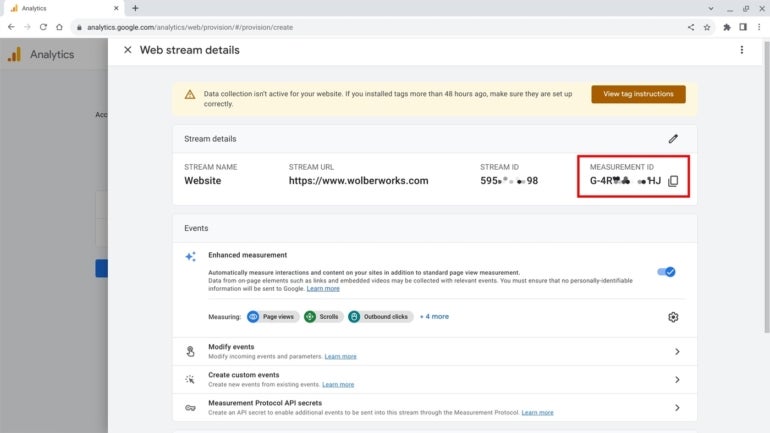
The system will display a Measurement ID. Copy this, take a photo or write it down as you will need it in a subsequent step.
How to add Google Analytics 4 to a Google Site
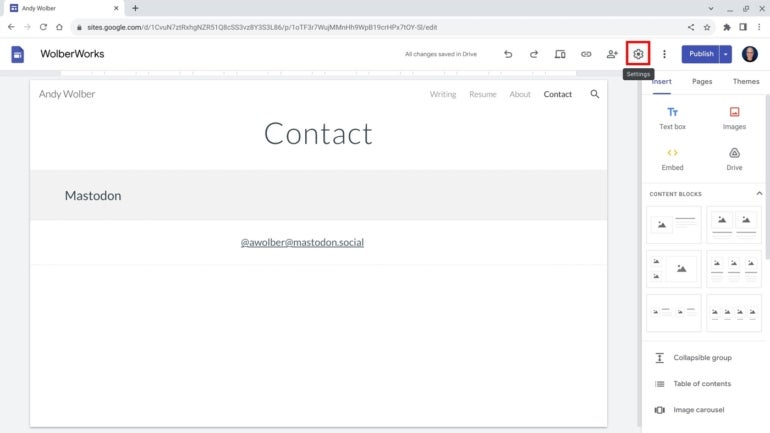
To add Google Analytics 4 to a Google Site, you’ll need to be either an Owner or an Editor of the Google Site. If you are, go to https://sites.google.com and select the Google Site you wish to link to your recently created Analytics web data stream.
- Select Settings at the upper right (Figure H).
Figure H
- Select Analytics.
- Enter the Measurement ID in the box and make sure the Enable Analytics slider is on (Figure I).
Figure I
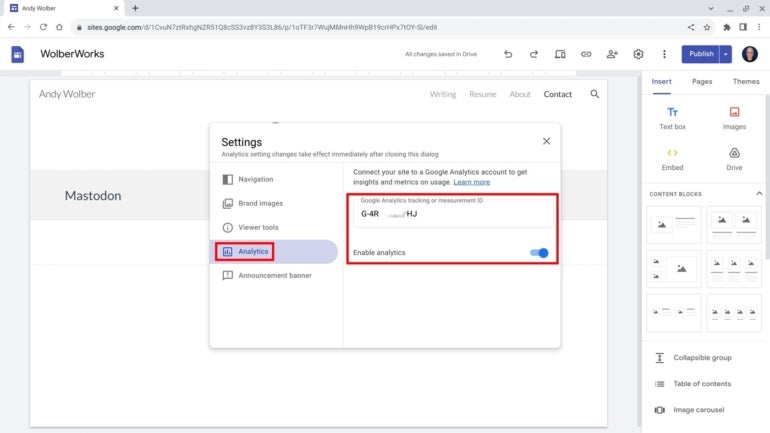
- Close the Settings box by selecting the x in the upper right corner.
Analytics will immediately be enabled; however, it may take as much as a full day for data from the stream to display in your Google Analytics account.
How to access Google Analytics 4 data
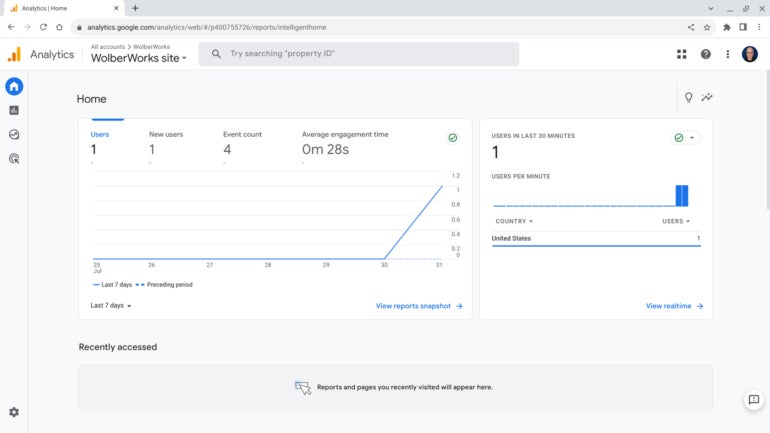
At least 24 hours after you added the Measurement ID into the Analytics section of your Google Site, check to make sure that data is flowing from your Site to Analytics. To do this, return to https://analytics.google.com. The initial screen should display recent Analytics data for your site (Figure J). (If you have Analytics accounts or properties, you may need to select your site from the account menu at the top of the screen.) Over time, as more data accumulates, you will be able to review reports and explore actions to better understand how people experience your site.
Figure J
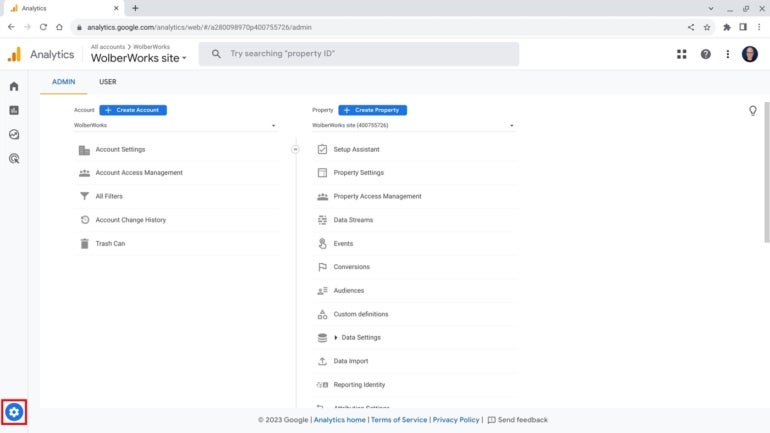
To make any changes or create other accounts or properties, select the Admin icon (i.e., the gear) in the lower left corner of the display (Figure K). Within the Property details, for example, you may review the Setup Assistant to troubleshoot issues, as well as manage Property Settings and explore Data Streams.
Figure K
Once configured, Google Analytics 4 will gather data about visitor activity on your Google Site. Make sure to review your Site’s Analytics data regularly. Depending on the visitor traffic levels, this might be a quarterly, monthly or weekly task.
Source of Article