The Soviet Union launched the Sputnik 1 satellite in 1957, placing the first human-made object in space. Fast forward to 2022, and we are now launching more than a thousand satellites into space each year, improving our weather forecasts, boosting our internet coverage and propelling the field of Earth science into new terrain. And for researchers studying the profound changes gripping our planet due to the climate crisis, that means they’ve got more eyes on the problem than ever before.
The idea of using satellites to gain a new perspective on our planet began with the launch of Sputnik 1, which transmitted radio signals from orbit that scientists used to gain new insights into the ionosphere. In the years and decades that followed, satellites have been launched to study the atmosphere, track weather patterns from space and monitor the planet’s land masses and seas.
More than half a century of satellite-based Earth observation has enabled scientists to follow important markers of the planet’s health. This includes detailed tracking of vegetation areas, soil quality, temperature shifts in different regions, sea level rise and the thickness of ice sheets. And as the sensing equipment we’re launching into space advances rapidly, we’re seeing the insights scientists can gain from these tools grow ever more precise.
Like “night and day”
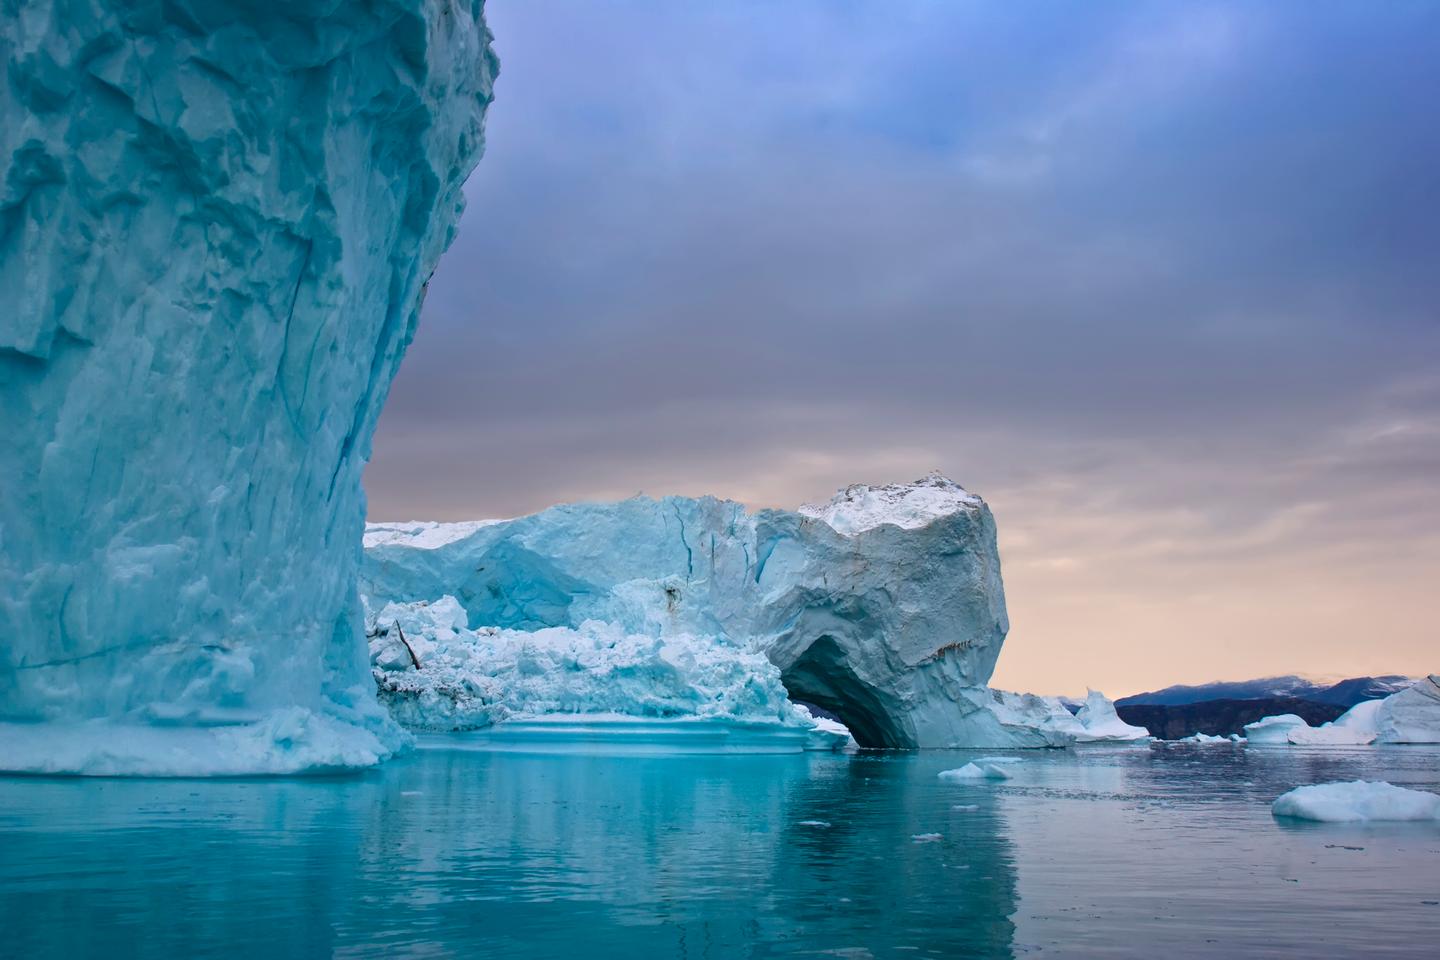
In August, a team of glaciologists studying the Greenland Ice Sheet made a striking discovery. The scientists tapped into data from satellites tracking monthly changes in the Earth’s gravitational field for a more accurate understanding of the seasonal shifts in the sheet’s mass, to understand the impending impact on global sea levels as it melts. Their conclusion? That the sheet is already destined to shed up to 110 quadrillion tonnes of ice, even if we stopped burning fossil fuels today. This is enough to drive up average global sea levels by almost a foot (30 cm).
“Certainty the engineering technology that we’re launching into space has undergone tremendous improvement in the past two decades,” Will Colgan, author of the study, explained to New Atlas. “If you look at the laser energy and return waveform that the original ICESat used versus the new ICESat-2, it’s like night and day, a 1990 Ford Festiva versus 2020 Tesla Model F. But, the ground segment has also improved tremendously. ICESat-2 sends back about 1 GB of data per day. Working with that data volume would have been inconceivable to most users just 10 years ago. But now higher performance computing advances mean many researchers can work with that data in meaningful ways.”
Earlier this year, we saw another example of modern satellite data reshaping our understanding of climate change. The Arctic is known to be warming faster than the rest of the planet, but a study published in August indicates this effect had been vastly underestimated. The authors drew on solid new satellite data from 1979 to 2021 to re-examine this rate of so-called Arctic amplification, and calculated that it is warming at four times the global average.
Another recent study examined the lake systems of the Arctic lowlands, using modern satellite data to detect patterns of surface water changes that revealed they are drying up at a greatly accelerated rate. This finding was made possible through advances in computing power to process the sensor data, which the authors said would not have been possible five or 10 years ago. Lately, we’ve also seen scientists harness these tools to offer year-round measurements of Arctic sea ice for the first time.
With more than 150 satellites currently observing the Earth from orbit and more on the way, the toolkit for climate scientists continues to grow more versatile. Let’s take a look at a few examples that are really changing the game.
“Together, I think these three satellite systems are really changing the way we see climate processes,” said Colgan.
Water meters in space
Back in March of 2002, NASA launched a pair of spacecraft designed to work in tandem to track the Earth’s gravitational forces. This Gravity Recovery and Climate Experiments (GRACE) mission operated between 2002 and 2017, with the GRACE Follow-On mission then launched in 2018 to carry on its work.
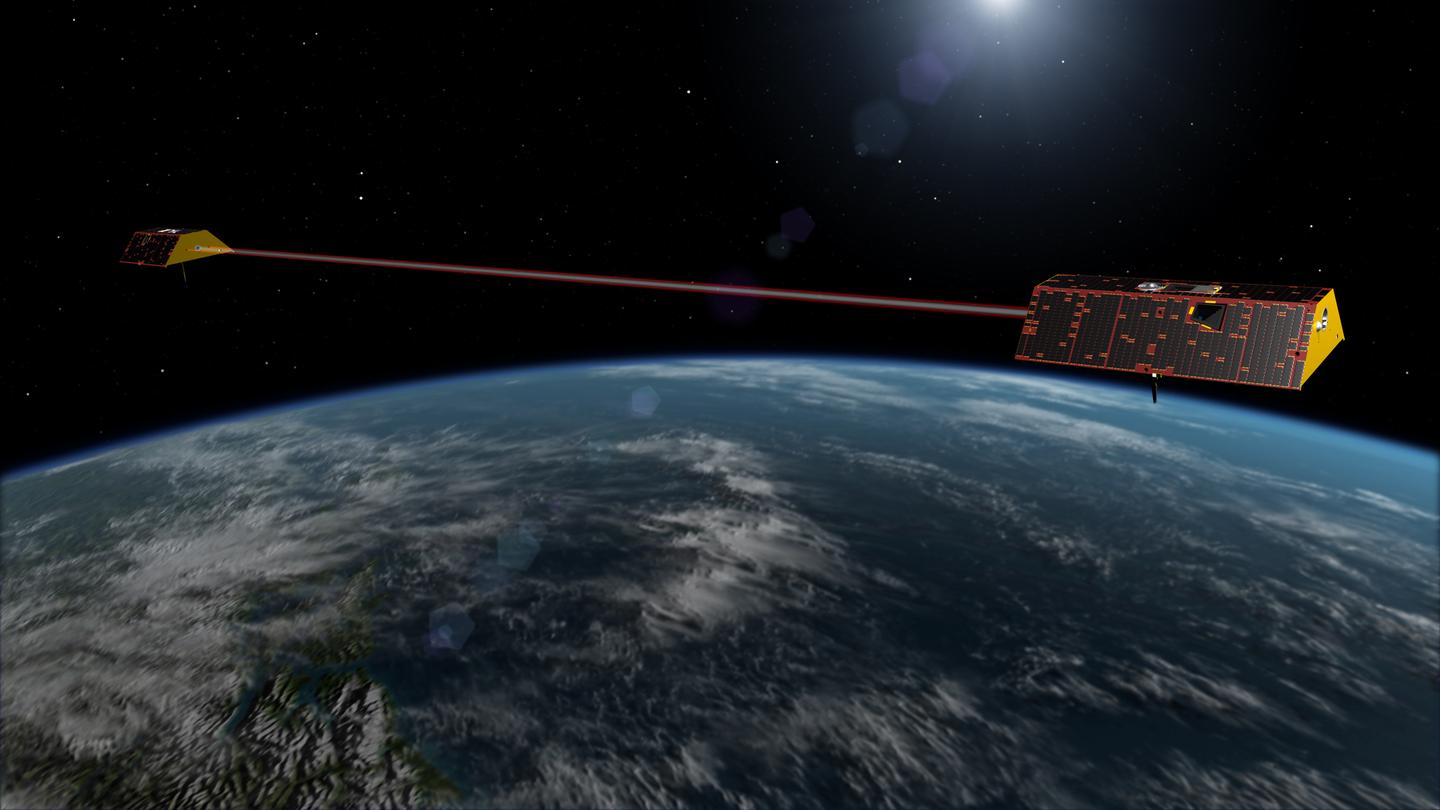
NASA/JPL-Caltech
This again involves two spacecraft, which circle the Earth at a distance of around 137 miles (220 km) from each other. Microwave signals are constantly shuttled back and forth between the spacecraft to closely monitor the distance between them. This distance shifts as the lead satellite is tugged on while passing over areas with stronger gravity, and again as the trailing satellite passes over the same area. By precisely tracking the accelerations caused by these gravitational forces, scientists can build a map of the planet’s gravitational field.
For the most part, this is used to measure how water moves around the planet, offering important insights into floods, drought, the use of groundwater aquifiers, sea level rise and ice loss at the poles. Data from GRACE-FO was key to the aforementioned study on melting of the Greenland Ice Sheet, and has also enabled scientists to directly measure the loss of ice mass in Antarctica for the first time, according to NASA’s Dr. Felix W. Landerer, Project Scientist for the mission.
“Being able to make these measurements was a huge step forward for researchers studying how climate change is affecting sea level rise,” he told New Atlas. “Over the last 20 years, GRACE and GRACE-FO missions have monitored global changes in Earth’s mass every month. This has resulted in far-reaching impacts to our understanding of the distribution of water on our planet and how that’s changed over the years. Both satellites are essentially ‘smart water meters’ in space that measure month-to-month changes in the mass of ice sheets and glaciers, near-surface and underground water storage, the amount of water in large lakes and rivers, as well as changes in sea level.”
An overview of the problem
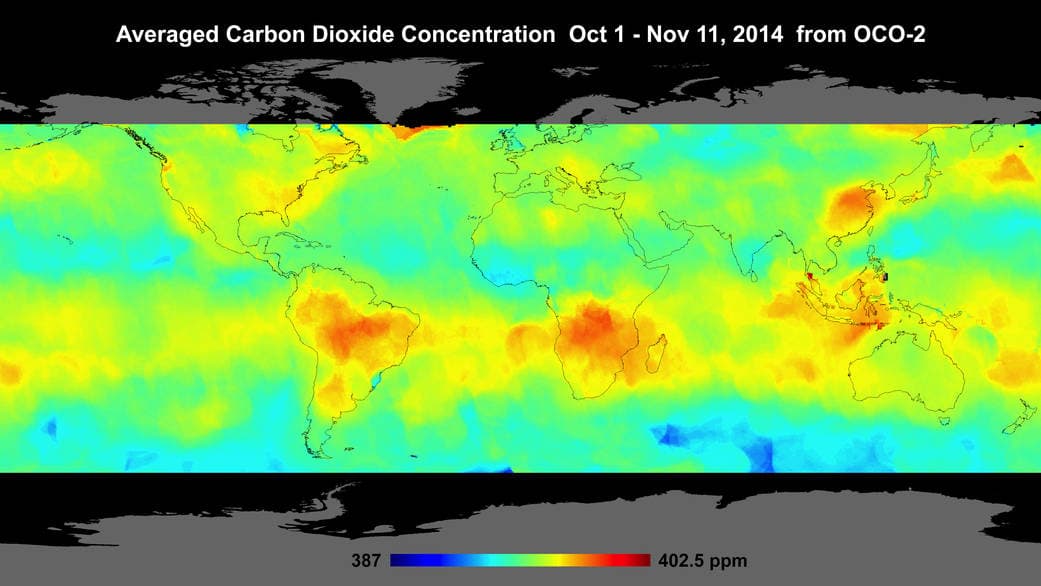
We know that carbon dioxide in the atmosphere is at the heart of the climate crisis, and monitoring stations on Earth have documented a dramatic increase in its concentration due to human activities. Launched in July 2014, NASA’s OCO-2 (Orbiting Carbon Observatory) mission was designed to collect accurate measurements of the greenhouse gas from space. This provides scientists with a global map of CO2 concentration, giving them insights into where levels are highest at different points in time.
NASA/JPL-Caltech
This furthers our understanding of how atmospheric CO2 interacts with the world’s many carbon sinks, such as plants, soils and oceans. The efficiency of these systems in absorbing carbon may fluctuate over time and could be impacted by the continual buildup of atmospheric CO2, and OCO-2 is offering scientists a powerful tool to explore these relationships.
“During the 2015-2016 El Nino – one of the strongest El Nino events in history – OCO-2 data confirmed that the Pacific Ocean plays an early and important role in moderating atmospheric carbon dioxide concentrations,” science lead for the OCO-2 mission, Junjie Liu, told us. “Researchers suspected this to be the case, but didn’t have enough measurements over a sufficient area to confirm this until OCO-2.”
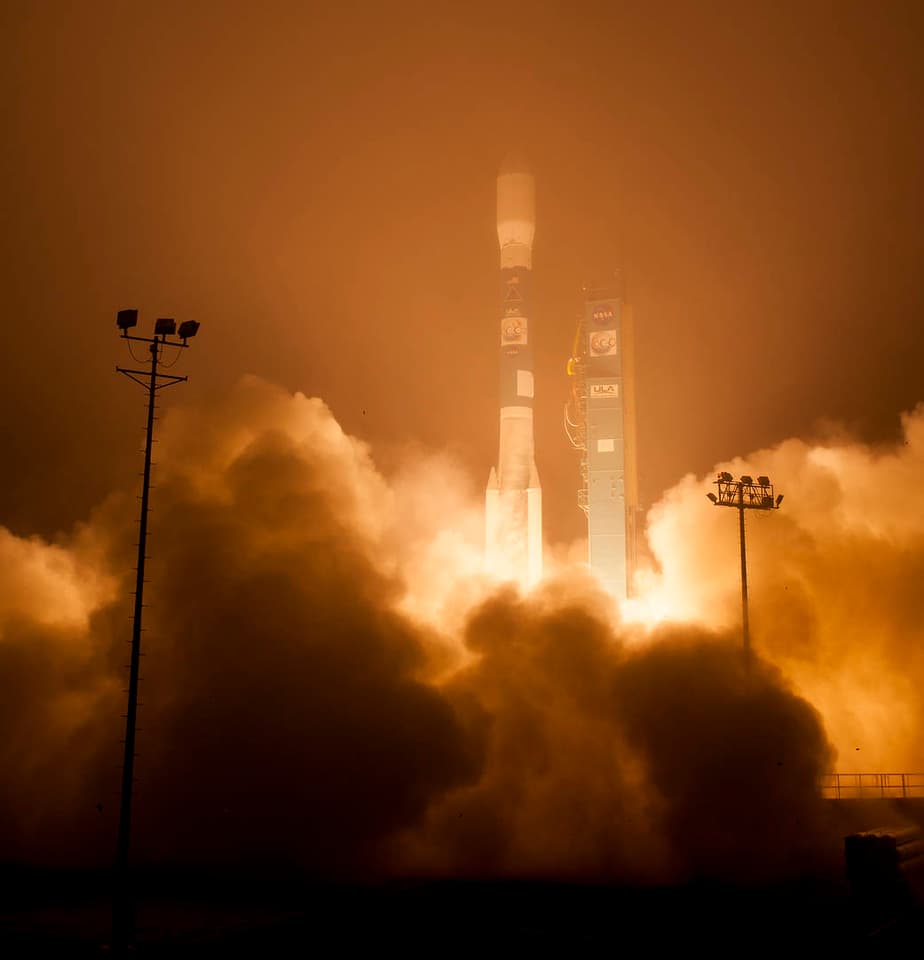
NASA/Bill Ingalls
Scientists expect OCO-2 to play an important role in projections of how atmospheric CO2 will impact on the Earth’s climate. The high-resolution measurements collected by the satellite will be key to understanding trends in the carbon cycle and its relationship with things like droughts and heatwaves. As scientists build a long-term picture of these trends, they can develop a better understanding of how things might look in the future.
“Continuing this eight-year data record will help researchers gain a clearer picture of how Earth’s carbon cycle will respond to long-term climate change, such as whether carbon sinks on land and in the ocean will continue to absorb excess atmospheric carbon dioxide,” said Liu. “Climate extremes like droughts and extreme heat play an outsize role in how the carbon cycle reacts to changes in climate from year to year. But it’s unclear at what point all of these interactions will tip the scales the other way and areas that currently soak up carbon dioxide start to release the greenhouse gas back into the atmosphere.”
Lasers and ice
In 2018, NASA launched a new mission to track melting ice sheets and glaciers using the most advanced laser altimeter it has ever sent into space. The instrument, packed aboard the now-orbiting ICESat-2 satellite, blasts trillions of photons toward the Earth’s surface every second and measures how long some take to return to the spacecraft, down to a billionth of a second.
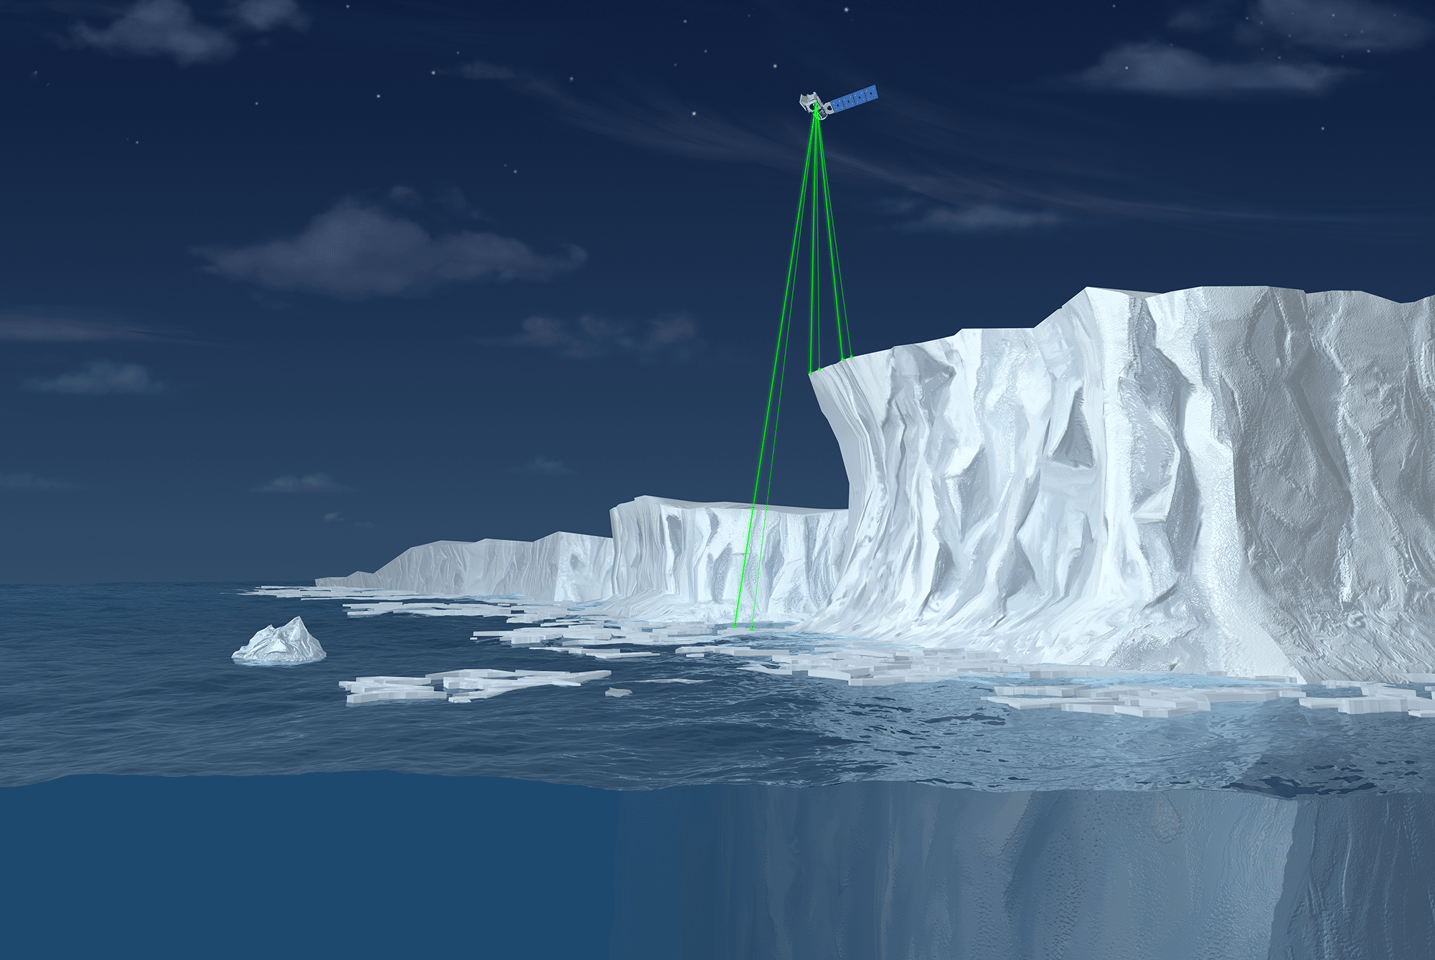
ICESat-2/SCAD Collaborative Student Project
ICESat-2 is on an orbital path that takes it around the Earth every 91 days, enabling it to build an elevation grid of the entire planet every three months. This includes not just the ice sheets, but lakes, forests and jungles, too. One way the satellite is proving its worth is by measuring the depth of melt ponds that form on top of sea ice, as Walt Meier, a sea ice scientist at NASA, explains.
“ICESat-2 has demonstrated the ability to obtain estimates of melt pond depth on sea ice,” Meier told us. “The depth indicates the total volume of the melt water and how ‘mature’ they are. Melt ponds are key aspects of sea ice because they lower the reflectivity of the surface (they are darker than the ice and snow) and that leads to more energy being absorbed by the surface. This leads to more melt and earlier loss of sea ice. Such depth data has not been available from satellites before ICESat-2.”
By tracking things like changes in sea ice coverage or the mass of ice sheets, scientists can get an idea of how the Earth’s climate is changing, and what course it might take into the future. Tools like ICESat-2 enable scientists to track these changes with unprecedented precision and regularity, shedding new light on long-term trends to offer a much clearer view of the future.
“As ICESat-2 continues to operate nominally, we will add to the time series of these variables, which allow us to separate short term fluctuations from the longer-term signals of greater interest and importance to climate science,” ICESat-2 project scientist Tom Neumann explained to New Atlas. “So although there have been over 200 peer reviewed papers using ICESat-2 data, I firmly believe that the most significant results from ICESat-2 are yet to come, as we build these time series of change.”
Source of Article