
Tableau Cheat Sheet: Complete Guide for Beginners
Tableau is a flexible BI and analytics tool that helps users in all industries with reporting and decision-making processes. Although, it may not be the best for individuals or startups…
Tableau is a flexible BI and analytics tool that helps users in all industries with reporting and decision-making processes. Although, it may not be the best for individuals or startups…

Image: ArieStudio/Adobe Stock Kelly Brough, director of applied intelligence at Accenture Australian enterprises are moving into a “readiness” phase of generative artificial intelligence adoption and will be relying on IT…

Image: PhotoGranary/Adobe Stock Microsoft Lists is a great way to share data; other users can view and even edit these lists if the author gives permission. And for our audience,…
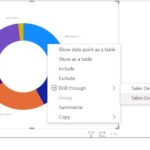
Image: Susan Harkins/TechRepublic Being able to drill down through a summarized visual to details or specific facts is an expected feature in dashboarding. Power BI supports this functionality, but it…

Image: monticellllo/Adobe Stock Learning how to use Power BI is fairly easy, and if you’re lucky, the built-in features will provide everything you need to produce professional dashboards for end…

Take a deep dive into Microsoft Power Query and Power BI with The Power Query for Excel & Power BI Course—now available for $25. Imaeg: StackCommerce In today’s competitive marketplace,…
Copyright © 2026 Nasni Consultants Ltd. All Rights Reserved